Auto loan balances, average amount financed, loan length, credit score, debt-to-income ratio, and delinquencies from subprime to prime.
By Wolf Richter for WOLF STREET.
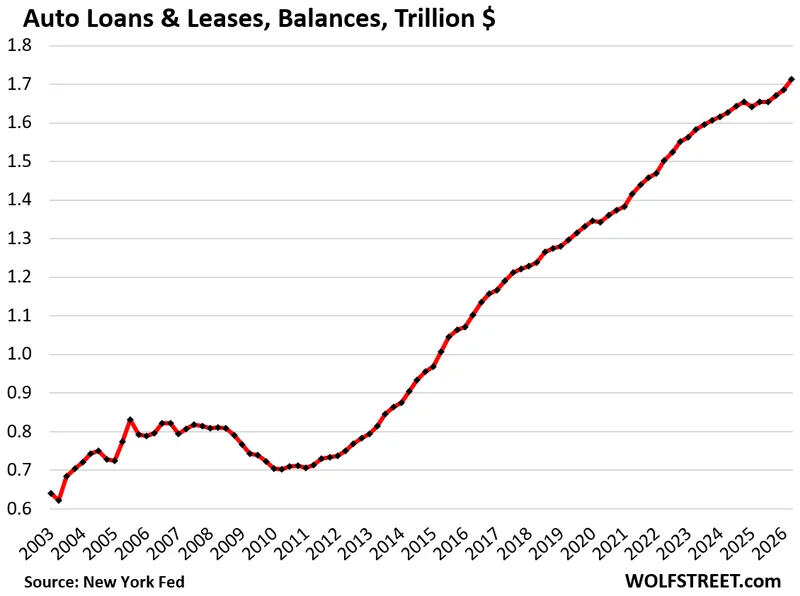
Loan and lease balances outstanding for new and used vehicles rose by $28 billion in Q2 from Q1, and by $58 billion (+3.5%) year-over-year, to $1.71 trillion, according to the New York Fed’s report on consumer credit, based on Equifax data.
Auto loan balances rose over the years with vehicle prices as automakers kept going upscale with bigger, fancier, and more advanced vehicles. Balances also rose as vehicle prices spiked during the high-inflation years and chip shortages of 2020-2023.
But two factors did not contribute to rising loan balances: Vehicle unit sales have remained below the levels before the pandemic, and the average length of new vehicle loans was where it had been a decade ago and shorter than in 2020.
The average amount financed for new-vehicle loans soared to a record $42,500 (red line in the chart below), as automakers continued to go upscale.
US legacy automakers, in their infinite Wall-Street-inspired wisdom, killed off most of their sedan models even before the pandemic and handed that lower-priced market segment to foreign brands. Luxury 4X4 Crew Cab pickup trucks with a $100,000 sticker, that’s what Ford now wants to sell. And Americans are loving them and are buying them. And it pushes up the loan balance and the average amount financed.
For used vehicles, the average amount financed had peaked at the end of the 50% price spike during the pandemic. Used-vehicle prices have declined from that peak, and the average amount financed, at $24,900 remains below that peak, according to data from the Federal Reserve Board of Governors for Q1 (blue line).
The average loan length for new vehicles ticked up to 66.5 months, a level it first reached a decade ago, in 2016, but that was down from the free-money pandemic peaks.
Auto loans by credit score: A near record-share of 54.6% of all auto loans and leases were made to borrowers with a credit score of 720 and higher. The record in the data was set last year at 56.1% (blue).
And the share of subprime borrowers hit a record low in Q4 last year of 15.0%, and in Q2 was at 15.6% (red).
Subprime means “bad credit” – a history of not paying bills and obligations. It does not mean “low income.” The young dentist that got into it over his head is a classic example of a high-income borrower with a subprime credit rating. They’ll get it worked out eventually. Subprime is not permanent.
Subprime lending is a specialized high-risk-high-profit business, often conducted by specialized dealer-lenders that securitize the loans and sell them as asset-backed securities to bond funds, pension funds, etc. Subprime borrowers pay very high interest rates and often pay a lot more for their vehicles, than prime-rated customers, and default rates are huge, but so are the profits on the loans and the vehicles, and the credit losses are part of the cost of doing subprime business. Periodically, some of these subprime-specialized dealers implode, which is why the business is high-risk.
The aggregate burden and credit risk of those auto loans can be evaluated via a debt-to-income ratio. For household income, we use “disposable income,” released by the Bureau of Economic Analysis.
Disposable income consists of after-tax wages, plus income from interest, dividends, rentals, farm income, small business income, transfer payments from the government, etc.
But it excludes capital gains, which is where the wealthy make most of their money. Excluded are thereby income from stock-based compensation plans and capital gains where billionaires make their billions.
Disposable income has grown over the years because the number of households has grown over, and the income per household has grown, and so total household income has grown – and it turns out it has grown about as fast as auto loans, with some ups and downs in between.
The auto-loan-to-disposable income ratio in Q2 ticked up a hair to 7.25%, right in the middle of the sine-wave of the past two decades.
Delinquency rates of subprime & prime auto loans.
The 60-plus-day delinquency rate for all auto loans and leases edged up to 1.42% in June, down by 2 basis points year-over-year, according to Equifax (red in the chart below).
The available monthly Equifax data only goes back to 2020, the free-money era when delinquency rates dropped to ultra-low levels. The increase since then is from those ultra-low levels. We lack the comparison to the pre-pandemic normal years.
The 60-day-plus delinquency rate of subprime auto loans ran at record highs starting in 2023, as a number of subprime dealer-lenders imploded – including Tricolor under a mushroom cloud of fraud allegations and some PE-firm-owned dealer-lender chains. Their customers stopped making payments, to see what would happen next. The delinquency rate is seasonal, and January is the high of the year. In January 2026, the delinquency rate was a record 6.90%, up by 34 basis points from January a year ago. But the delinquency rate improved this year and started running below year-over-year levels.
The subprime delinquency rate was 5.67% in June, down by 64 basis points year-over-year, according to Fitch Ratings, which rates these ABS (yellow in the chart below).
The 60-day “Prime” delinquency rate was a pristine 0.37%, according to Fitch, which tracks prime auto loans that were securitized into prime ABS (blue in the chart). Prime-rated auto loans are nearly always in good shape.
And in case you missed them:
Enjoy reading WOLF STREET and want to support it? You can donate. I appreciate it immensely. Click on the mug to find out how: