Science seems like a straightforward endeavour. You come up with a hypothesis, collect data to prove or disprove it, and analyze that data to see if the hypothesis is right. But anyone who actually does science will tell you many times itâs not that straightforward. And one of the most common complexities is in data analysis. A new paper suggests that one such complexity, known as regression to the mean, might be causing us to massively underestimate how severe solar storms can truly be.
The interaction between the solar wind and Earthâs magnetosphere can be thought of as a giant dynamo. The combination of solar wind and magnetic field drives high-speed plasma and electric currents down into the upper atmosphere, particularly around the polar caps (hence the appearance of auroras). Scientists typically track this dynamo effect using the Polar Cap Index (PCI).
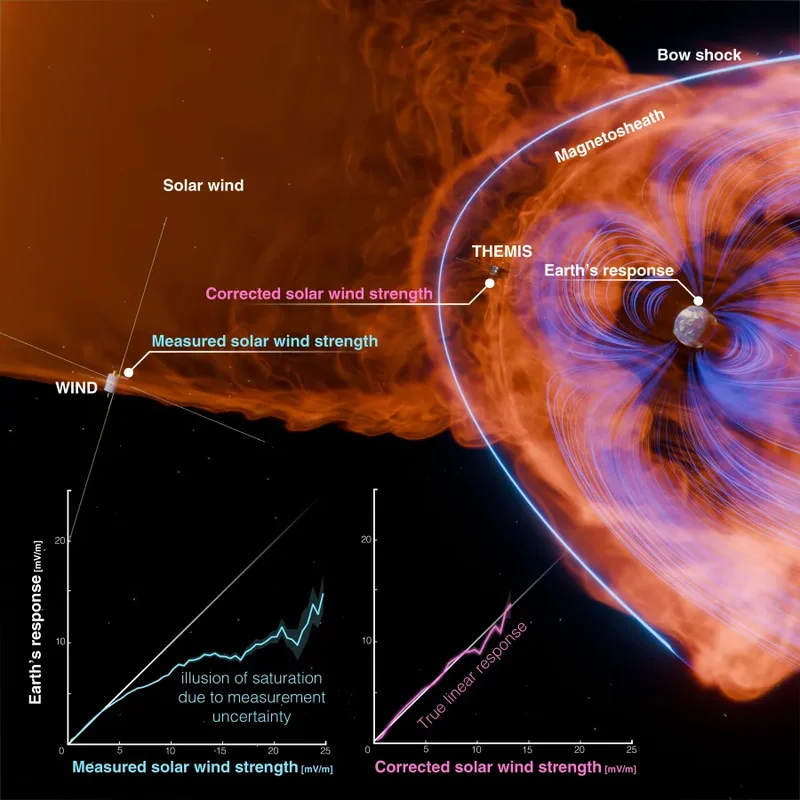
One thing has been clear for decades - for moderate solar activity, there is a very clear linear relationship between solar wind electric fields and the electric response measured on Earth. However, for stronger storms, that relationship breaks down as the Earthâs response seems to âsaturateâ - i.e. cap out at a certain level below what would otherwise be expected. But we never really understood why.
According to a new paper by Dr. Nithin Sivadas and their co-authors at NASAâs Goddard Space Flight Center, and published in Nature, that saturation might simply be an illusion because of how we measure the strength of the solar storms. They noted that most solar wind measurements come from satellites like WIND, ACE, or DSCOVR, all of which are located at the L1 Earth-Sun Lagrange point - which means they are 1.5 million km closer to the Sun than Earth is.
That distance introduces a ton of uncertainty. The timing of wind propagation varies, making timing precision difficult. The wind itself can change in the intervening 1.5 million km, and shock fronts can introduce âheteroskedastic noiseâ - i.e. random errors that grow larger in extreme events. Those errors all make for a situation where we are measuring a highly uncertain value far upstream, which causes a fundamental rule of statistics to come into play - regression to the mean.
Essentially, scientists paired extreme measurements at the L1 satellites with the smaller, more average geomagnetic responses they triggered in the magnetosphere, since the âtrueâ solar wind hitting Earthâs magnetosphere is much more likely to be less extreme and closer to the mean measured there. This mathematical mismatch - of an extreme event at L1 and a more moderate one at Earth, causes a ânonlinear regression biasâ in the data curve, artificially bending it and making Earthâs response appear âsaturatedâ.
To prove their point, the authors applied a âregression calibrationâ to offset some of the bias. After doing so, the linear relationship between solar storm strength and Earthâs magnetic response continued linearly, with no clear saturation effect. Put simply, a 1 in 1000 year solar storm event would now be much more likely to cause a massive amount of destruction than we had originally thought.
But this finding isnât relevant only to space weather. The authors point out that everything from seismology to medical trials can fall victim to the mean masquerading as a threshold. Machine learning exacerbates the problem, as models trained on uncertain inputs will simply learn the statistical illusion and think it's a physical reality.
The immediate takeaway is clear, though - Earthâs powergrid and satellite constellation operators need to consider the possibility of a much more massive electrical spike if a very severe solar storm hits. The natural protection we thought we had with the magnetosphereâs saturation unfortunately appears to be just a statistical illusion.
Learn More:
NASA - New NASA Study Says Possibly No Limit to Solar Storm Effects
N. Sivadas et al. - Regression to the mean can explain saturation of geomagnetic storms