Bond Vigilantes dissolved long ago into ambient air. But these auction yields make Bessent nervous.
By Wolf Richter for WOLF STREET.
The US government sold $742 billion of Treasury securities during the week, spread over nine auctions. Of them, $585 billion were Treasury bills with maturities from 4 weeks to 26 weeks, spread over six auctions. Three of these auctions were over $100 billion each. Most of these sales replaced maturing T-bills.
And $157 billion of the auction sales were 3-year and 10-year Treasury notes and 30-year Treasury bonds. The 10-year notes sold at the highest auction yield since 2007. The 30-year bonds sold at the highest auction yields since 2001.
| Treasury note and bond auctions this week: | |||
| Notes & Bonds | Auction date | Billion $ | Auction yield |
| Notes 3-year | Aug-11 | 73 | 4.291% |
| Notes 10-year | Aug-12 | 53 | 4.683% |
| Bonds 30-year | Aug-13 | 31 | 5.216% |
| Notes & bonds | | 157 | |
The Bond Vigilantes dissolved long ago into ambient air whence they’d come. But these auction yields make Bessent nervous, enough so that he attempted to bail out the yen so that the Japanese authorities wouldn’t have to sell Treasuries to raise the USD-cash to buy yen in order to prop up the yen. Bessent was worried that by selling Treasuries, the Japanese would push Treasury yields even higher.
The 30-year Treasury bonds sold at auction on Thursday with a yield of 5.216%, the highest auction yield since the 30-year auction in August 2001.
But, but, but… August 2001 was the last 30-year bond auction until 2005, as big budget surpluses were on the horizon, and the long-bond was no longer needed. But in 2005, when the big surpluses on the horizon had turned out to have been a mirage, and the deficits had re-exploded, the 30-year bond was reintroduced. During that four-year gap with no 30-year bond auction, long-term yields were mostly higher than currently, and if there had been 30-year bond auctions during that gap, this week’s auction yield of 5.216% would have likely been the highest since 2004, and not since 2001. Just quibbling.
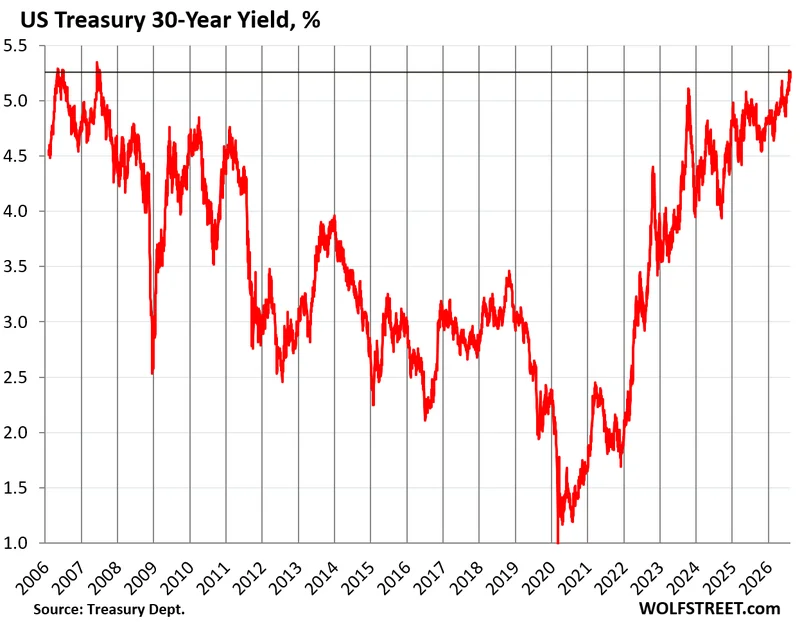
In the secondary market, the 30-year yield closed at 5.26% on Friday, after having traded as high as 5.28% on Tuesday and as low as 5.19% briefly Thursday morning in a kneejerk reaction to the CPI report before the auction, but largely reverted just in time for the auction.
These 5.20%-plus yields are the highest secondary-market yields since 2007. The chart shows the last 14 years of the 40-year bond bull market (when yields fall, bond prices rise), and the first 6 years of the bond bear market (when yields rise, bond prices fall).
Thirty years is a long time for things to go wrong, for inflation to go haywire, for the fiscal situation of the federal government to deteriorate further, producing a pile-up of new debt to fund it all, and for the debt to become manageable only through higher inflation. Those are real risks over the next 30 years.
And bond buyers want to be compensated for those risks by demanding a higher yield. But there is a lot of disagreement between buyers and sellers about how much risk there really is since no one knows the future, which is what makes a market.
How big are the losses six years into the bond bear market? Investors who bought 30-year bonds at auction in 2020 at less than 1.5% yield should have seen the same risks but were blinded by the Fed’s QE and by wild and woolly hopes of negative interest rates and ended up with massive losers in their portfolios.
For example, the 30-year bond that was sold at auction in August 2020, maturing in August 2025, with a coupon interest rate of 1.38% (CUSIP 912810SP4), is currently quoted at a price of about 46 cents on the dollar, in other words, 54% below face value. But at this price, today’s buyers get a yield to maturity of 5.39%.
By February 2021, bond yields were already rising, and the losses are smaller – but still huge. For example, the Treasury Department, at a recent buyback auction, paid 54 cents on the dollar for 30-year bonds originally sold at auction in February 2021 at a yield of 1.93% (the Treasury Department conducts two buyback auctions per week, spread across maturities, each auction totaling $2 billion currently).
Buyers and sellers of long-term bonds react to fears about inflation, about a lax Fed when inflation does take off, and about the debt-pileup and the new supply of debt that the market has to absorb, likely at a higher yield to create enough demand.
The Fed hasn’t been helping at all: By cutting rates even as inflation remained high in 2024, and by cutting rates further in late 2025 even as inflation had already begun to accelerate again, the Fed signaled to the bond market that it would give this inflation some room to run, that it would “look through” this inflation for a while, before trying to step in. And now it’s August, inflation is higher than it was a year ago, and the Fed still hasn’t stepped in.
The 10-year Treasury notes sold at auction on Wednesday at a yield of 4.68%, the highest auction yield since the auction in August 2007.
In the secondary market, the yield did a quick kneejerk drop after the headline of the CPI came across before bouncing back, and it closed on Friday at 4.70%.
Here we’re looking at the last four years of the brutal bond bear market through late 1981, then the 40-year bond bull market through August 2020, followed by the six years of the current bond bear market.
The government sold $585 billion of T-bills this week, at auction yields that have come down some since the no-rate-hike FOMC meeting on July 29. But compared to a month ago, they barely changed: some ticked up a couple of basis points, others ticked down a couple of basis points, and two were unchanged. And all were up substantially from June and prior months.
Yields of T-bills react to the Fed’s policy rates and to expectations of the Fed’s policy rates in the near future. They’re less influenced by inflation and supply fears – unlike long-term Treasury securities.
| Treasury bill auctions this week: | ||||
| Type | Auction date | Billion $ | High Rate | Investment Rate |
| Bills 4-week | Aug-13 | 118 | 3.625% | 3.686% |
| Bills 6-week | Aug-11 | 101 | 3.670% | 3.737% |
| Bills 8-week | Aug-13 | 107 | 3.665% | 3.737% |
| Bills 13-week | Aug-10 | 98 | 3.735% | 3.823% |
| Bills 17-week | Aug-12 | 77 | 3.755% | 3.855% |
| Bills 26-week | Aug-10 | 84 | 3.830% | 3.960% |
| Total T-bills | | 585 | ||
The $84 billion of 26-week T-bills cleared the auction on Monday at a “high yield” of 3.830% or at an “investment rate” of 3.96%, the same as a month ago, but down by about 12 basis points from the auction just before the no-rate-hike FOMC meeting when 6-month T-bills had sold at an investment rate of 4.08%.
In the secondary market, the 6-month Treasury yield closed on Friday at 3.95%, according to Treasury Department calculations (that calculation method is close to the “investment rate” at the T-bill auctions).
The 6-month yield is 32 basis points above the Effective Federal Funds Rate (EFFR, blue, 3.63%), which the Fed targets with its policy rates. So the expectations of a rate hike within its window have remained intact.
The $98 billion of 13-week T-bills cleared the auction at a “high yield” of 3.735% or at an “investment rate” of 3.823%, the same as a month ago, but down from the auction just before the July no-rate-hike FOMC meeting.
Note the mini-spike just ahead of the FOMC meeting to reflect the expectation of a rate hike at the July meeting, and the drop-back when that rate hike didn’t come.
Enjoy reading WOLF STREET and want to support it? You can donate. I appreciate it immensely. Click on the mug to find out how: