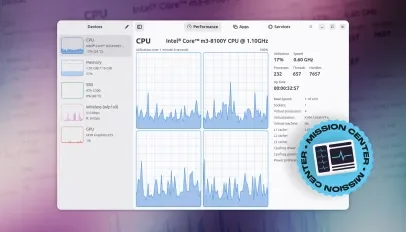
A new version of the slick Linux system monitoring app Mission Center is available for download with expanded hardware coverage and resource reporting.
Notably, Mission Center v1.2.0 adds a new Battery page in the Performance tab, surfaces per-partition usage details on the Disk page with free and used space reporting and adds a new graph to the bottom of the CPU page to relay temperature, power draw or CPU frequency – you can change it.
The Memory page now shows compression (zRAM/zswap) stats, while the GPU page lets you switch the middle graph between Encode/Decode activity, power draw, clock speeds or temperature (depending on what your graphics card can/does report on Linux).
Mission Center’s other changes
The graphing backend was overhauled to deliver smoother animations and rendering, and when launching the app on slower systems you may notice a brief “shimmer” of grey placeholder charts before the real ones load in, making it clearer the app isn’t hanging.
Mission Center is a system monitor, and can show detailed information about active processes, services and their relative resource usage. Application detection has been improved to ensure more apps show the right name, icon and so on.
For some features, like CPU power draw, process-level network usage and fan readings to work, Mission Center 1.2.0 will prompt you to run a setup script. You can say no, but some advanced features won’t report fully/properly.
Mission Center’s official Snap and AppImage packages were improved. The Snap was upgraded to use the core24 runtime, while the AppImage was made smaller in size, uses quick-sharun for building and no longer depends on FUSE.
Plenty of bug fixes made it into this update, the first major one this year, including snafus with CPU temperature reading on the Steam Deck, blurry app icons on HiDPI displays, a SMART dialog that was a little too wide and phantom CPU usage spikes when the system is idle.
New keyboard shortcuts were added:
- Hold-
ctrl- to pause UI changes - Double-click or use left/right arrow keys to collapse and expand rows in- Apps
alt+-1/-2/-3- ,- etc to switch pages and-f9- toggles the sidebar
Other changes of note:
- Swap usage is now per-process swap instead of shared memory in- Apps
- Hybrid PSS approximation for per-process memory usage
- Send process signals that require elevation via-
pkexec - Disabling device categories and individual network types
- Connection state now listed in the- Networkdetails sidebar
- About Systemdialog shows more info, supports copy
A solid update for what I think is one of the clearest and slickest Linux system monitors (for those itching to ask, yes: the design of Mission Center was inspired by Windows’ Task Manager).
Ubuntu’s decision to make Resources the default system monitor – it did consider Mission Center – means many may no longer feel as inclined to seek out an alternative way to glean more or less the same set of stats.
Personally, I’ve always loved the look and layout of Mission Center, and with the latest update, the additional information makes it even more indispensable for my needs. I remain a btop fanboy at the command-line, but for GUI needs, this is the GOAT.
Where to get Mission Center 1.2.0
Mission Center is free, open-source software built using Rust and GTK4/libadwaita, with more information on the official website and the Gitlab project page, the latter also where you can download an AppImage.
Alternatively, you can install Mission Center from Flathub or the Snap Store. If you’re on Ubuntu, search for it in the App Center or open your terminal and run:
sudo snap install mission-center
Let me know what you think of this update in the comments.