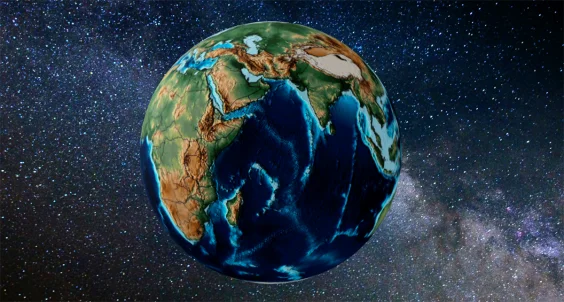
The amount Earth’s tectonic plates move might be imperceptible during the course of our individual lifetimes, but over many millennia those shifts add up, so much so that world maps are nearly unrecognizable across epochs.
Now there’s a brand new way to visualize these shifts on the Internet—and you can use it to see where your neighborhood was situated 145 million years ago with a single click. It’s called the Paleocoordinates Calculator, or PACA.
Once you’ve loaded up the site, click Try My Location, agree to share your location, and check out where your home would have stood during the age of the dinosaurs, right between the Jurassic and Cretaceous periods.
Read more: “Pangea’s Second Coming Won’t Be Chill”
Beyond being a great timewaster, the site has a serious scientific purpose too: placing fossils. Given the continental shifts that have happened over eons, it can be a challenge for paleontologists to figure out what location a fossil finding is from. We know where the excavation site is now, but where was it hundreds of millions of years ago?
The PACA site enables researchers to upload CSV files containing the current coordinates and estimated age of a fossil, and get back a dot on a map showing where it would have been when it was originally fossilized—within seconds, too.
“This innovative interface removes methodological barriers,” Antonio Monleón-Getino, the head of the BIOST3 Research Group at the University of Barcelona that developed the tool, said in a statement.
The PACA tool is based on five models of global plate movement, and users can compare any variations between them when viewing the fossil location results. All the models are already widely used within the scientific community.
In a report on the capabilities of the tool published in Scientific Reports, the researchers say average discrepancies from PACA are under 56 feet, compared with the more traditional (and slower) approach of the GPlates desktop software.
And unlike with GPlates, PACA requires no technical know-how or programming expertise to work. You just bring your CSV file (or click the button). There’s also the neat 3-D visualization, which GPlates doesn’t have.
“These advancements not only deepen our understanding of the past but also enhance our comprehension of the present and even inform predictions of future planetary changes,” the researchers wrote in the paper.
Give it a go and see just how far your neighborhood has come.
Lead image: PACA