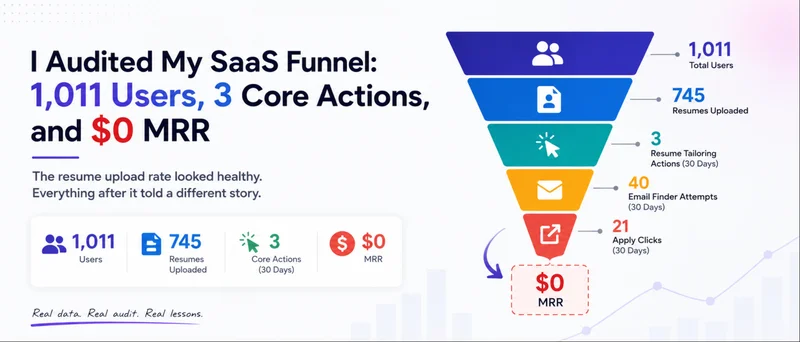
I had 1,011 registered users.
Out of those users, 745 had uploaded at least one resume.
That meant almost 74% of registered users had completed one of the main onboarding steps.
For an early product, that looked encouraging.
People were finding the site. They were creating accounts. Most of them were willing to upload a document containing their personal work history.
I thought the product had a strong base.
Then I checked what users did after uploading their resumes.
The numbers changed the entire picture.
During the previous 30 days:
- Users uploaded 162 resumes.
- Users completed three resume-tailoring actions.
- Users made 40 email-finder attempts.
- Users clicked an external job application 21 times.
- Stripe showed zero active paid users.
- Stripe monthly recurring revenue was $0.
The product had interest.
What it did not have was enough proof that people were reaching its main value.
The Metric That Made Everything Look Better
The app I built helps job seekers upload a resume, view job matches, tailor their resume, find employee contacts, and apply with more focus.
Resume uploads were easy to measure.
The user either uploaded a file or did not.
The database recorded that action clearly. The total kept rising, and it became the number I watched most often.
That was my mistake.
Uploading a resume was an onboarding action. It was not proof that the user had solved a problem.
The user had given the product information, but the product had not yet proven that it gave enough value back.
I had treated setup completion like activation.
Those are not the same thing.
A completed profile, connected account, imported file, or uploaded document can look impressive on a dashboard. However, those actions may only show that users are curious enough to begin.
The real question is what they do next.
Do they reach the useful part?
Do they complete an action tied to the reason they signed up?
Do they return?
Do they eventually pay?
My dashboard could answer the first question poorly and the remaining questions barely at all.
The Funnel Looked Like This
| Funnel signal | Recorded result |
|---|---|
| Total registered users | 1,011 |
| Users with at least one resume | 745 |
| Resume uploads during the last 30 days | 162 |
| Resume-tailoring actions during the last 30 days | 3 |
| Email-finder attempts during the last 30 days | 40 |
| External apply clicks during the last 30 days | 21 |
| Stripe active paid users | 0 |
| Stripe MRR | $0 |
These numbers do not form a perfect conversion funnel.
Some are lifetime totals. Others cover only the previous 30 days. A single user can also perform the same action several times.
For that reason, I cannot honestly say that exactly 1.85% of resume uploaders tailored a resume.
Three actions divided by 162 uploads may produce that number, but it would mix actions, users, and time windows.
That would look precise without being reliable.
Still, the gap was too large to ignore.
There were many resume uploads and very few recorded actions tied to the product’s main promise.
I Had an Activation Problem, but Also a Measurement Problem
A common startup funnel includes acquisition, activation, retention, referral, and revenue.
This is often called the AARRR framework. HackerNoon has a useful breakdown of how those stages connect to product goals in its article on product metrics and the AARRR funnel.
I had acquisition data.
I could see registrations and resume uploads.
I also had some revenue data because Stripe gave me a clear answer: zero paid users and $0 MRR.
The middle of the funnel was the problem.
I could not trace each user from signup through one complete path:
signup
  -> resume uploaded
  -> dashboard opened
  -> job match viewed
  -> resume tailored
  -> employee contact searched
  -> application clicked
  -> pricing viewed
  -> checkout started
  -> trial started
  -> payment completed
Some events existed.
Others were missing, weak, duplicated, or recorded in different systems.
This created a dangerous situation.
When a funnel is missing steps, people often fill those gaps with stories.
Maybe users loved the matches but were not ready to apply.
Maybe they found jobs elsewhere.
Maybe they planned to return later.
Maybe pricing was the problem.
Maybe checkout was broken.
Maybe the match scores did not feel trustworthy.
Any of those explanations could be true.
The data did not prove them.
That meant the first job was not to invent a better story. It was to improve the measurement.
The Events I Should Have Defined Earlier
Google Analytics supports recommended events such as sign_up, begin_checkout, and purchase. It also allows custom events when the recommended list does not describe a product action.
Google explains the difference in its official GA4 event documentation.
For this product, the basic event list should have looked like this:
sign_up
resume_upload_started
resume_upload_success
dashboard_opened
job_match_viewed
resume_tailor_started
resume_tailor_success
email_finder_started
email_finder_success
job_saved
apply_click
pricing_viewed
begin_checkout
trial_started
purchase
subscription_cancelled
Naming events is the easy part.
The harder part is defining exactly when each event fires.
For example, resume_tailor_success should not fire when a user clicks the Tailor button.
It should fire only after the server returns a valid tailored result and the user can view it.
The same rule should apply to the email finder.
email_finder_started records intent.
email_finder_success records delivered value.
Those two events answer different questions.
A useful tracking plan needs both.
I Also Needed One Event Contract
When event names are typed by hand across many components, small differences can split the data.
One file might send:
resume_tailor_success
Another might send:
resume_tailoring_success
A third might send:
tailor_completed
The product may treat those as the same action. The analytics system will not.
A shared event contract reduces that risk.
This is the kind of TypeScript structure I should have used from the start:
export const AnalyticsEvents = {
  SIGN_UP: "sign_up",
  RESUME_UPLOAD_SUCCESS: "resume_upload_success",
  DASHBOARD_OPENED: "dashboard_opened",
  JOB_MATCH_VIEWED: "job_match_viewed",
  RESUME_TAILOR_STARTED: "resume_tailor_started",
  RESUME_TAILOR_SUCCESS: "resume_tailor_success",
  EMAIL_FINDER_STARTED: "email_finder_started",
  EMAIL_FINDER_SUCCESS: "email_finder_success",
  JOB_SAVED: "job_saved",
  APPLY_CLICK: "apply_click",
  PRICING_VIEWED: "pricing_viewed",
  BEGIN_CHECKOUT: "begin_checkout",
  TRIAL_STARTED: "trial_started",
  PURCHASE: "purchase",
  SUBSCRIPTION_CANCELLED: "subscription_cancelled",
} as const;
export type AnalyticsEvent =
  (typeof AnalyticsEvents)[keyof typeof AnalyticsEvents];
Each event also needs a small, stable set of properties.
For example:
type JobActionProperties = {
  user_id: string;
  job_id: string;
  company_id?: string;
  match_score?: number;
  source_page: string;
  occurred_at: string;
};
This does not solve product analytics by itself.
It does make the data easier to test, review, and trust.
Stripe Had to Remain the Revenue Truth
The product database contained subscription-related states.
Stripe contained the actual payment records.
When those systems disagree, Stripe must answer the revenue question.
A database row saying that a user has Pro access does not prove that the user paid.
It may represent:
- A manual account upgrade
- A free test account
- An old subscription state
- A failed webhook
- A canceled subscription
- A migration error
Only the billing system can prove that money was collected.
Stripe uses webhooks to notify an application when billing events occur. Its official subscription webhook documentation explains how subscription changes reach an application.
The full payment path needed to be tested as one flow:
new account
  -> pricing page
  -> checkout session
  -> card or trial created
  -> Stripe webhook received
  -> subscription stored
  -> Pro access unlocked
  -> analytics event recorded
  -> cancellation tested
Testing checkout by confirming that the Stripe page opens is not enough.
The test ends only when every system agrees about the same user.
Zero Saved Jobs Was Another Warning
The database also showed zero saved jobs.
There were several possible explanations:
- Nobody used the feature.
- The save button did not work.
- The product stored saved jobs in another table.
- The database query was wrong.
- The feature existed in the interface but was hard to find.
Again, the number did not prove which explanation was correct.
It did prove that the feature could not be trusted as a healthy part of the user journey.
A product team should not promote a feature until it can answer three basic questions:
- Can a user find it?
- Does it work?
- Can we measure its use?
Zero may represent poor demand.
It may also represent a bug.
Both require investigation.
The Database Size Was Not the Main Problem
The product had more than 250,000 jobs in its database, with over 100,000 marked active.
The matching system had also produced a large number of job-resume scores.
That supply looked impressive.
But more job records did not fix the user journey.
A user does not receive value because a database is large.
The user receives value when the product helps them make a better decision or complete a useful task.
For this product, that might mean:
- Finding one strong job match
- Understanding why the match is strong
- Fixing a weak resume section
- Finding one employee at the company
- Saving the job for later
- Completing an application
The size of the system mattered less than the movement of one user through it.
My New Definition of Activation
I needed a stricter activation event.
A resume upload was too early.
A payment was too late.
The better definition was:
A user views a matched job and completes at least one useful job action.
A useful job action could include:
- Tailoring a resume
- Finding an employee contact
- Saving the job
- Clicking the application link
This definition is not final.
It still needs testing against retention and payment.
However, it is closer to user value than simply counting uploaded files.
The goal is not to choose an event that makes the product look successful.
The goal is to find the earliest action that predicts that users understand the product and return.
The Product Flow Also Needed Fewer Choices
After uploading a resume, users could enter a dashboard with several tools and options.
That may feel helpful from a builder’s view.
It can feel like work from a new user’s view.
A better first session should answer one question:
What should I do next?
The revised path is much simpler:
- Show the user their strongest job matches.
- Explain why the first match is strong or weak.
- Offer three next actions.
- Track the result of each action.
The three actions should be clear:
Tailor your resume
Find an employee
Apply to the job
Not ten cards.
Not a tour of every feature.
Not a dashboard asking the user to design their own workflow.
One job. Three actions. One measurable result.
What I Am Fixing Before Chasing More Traffic
The audit changed the order of work.
The old instinct was to get more visitors.
The new order is:
1. Verify the payment path
Test signup, checkout, Stripe events, account access, tracking, and cancellation.
2. Create one event specification
Document each event, its trigger, its properties, and its source.
3. Repair the post-upload path
Show a useful job match as soon as the resume is ready.
4. Reduce the number of first-session choices
Push the user toward one real job action.
5. Inspect behavior directly
Review sessions and speak with users instead of guessing why they stopped.
6. Measure cohorts, not mixed totals
Track users who signed up during the same period and follow their actions over time.
7. Delay large promotion
More traffic would only send more people into a path I could not explain.
Five Lessons I Wish I Had Applied Earlier
1. Signups Are Not Activation
A signup proves interest.
It does not prove value.
2. Setup Can Hide a Weak Product Loop
Users may complete setup because they expect value next.
The next action shows whether the product delivers it.
3. Use the Billing System for Revenue
Access flags and database states are not revenue.
Payments are revenue.
4. Missing Events Create False Confidence
When data is missing, optimistic stories fill the gap.
Track the full path before explaining it.
5. Do Not Scale a Funnel You Cannot Describe
More traffic is not always progress.
Sometimes it only creates a larger unknown.
The Most Painful Number Was Not $0 MRR
Seeing $0 MRR was uncomfortable.
But it was clear.
The more painful discovery was that my strongest-looking metric did not measure the value users received.
I had 1,011 users.
I had 745 users with resumes.
I also had only three recorded resume-tailoring actions during the previous 30 days.
That gap changed the question I was asking.
The question was no longer:
How do I get more users?
It became:
How do I help one current user complete one useful action, and prove that it happened?
That is a much less exciting question.
It is also the one the product needs answered first.