AI's water problem is smaller than you've been told. Water's problem is far bigger — and, for the first time, solvable.
Sometime in the last two years, a very old argument about water got a very new participant.
For most of human history, the fight over who gets the river has been between farmers, cities, and fish. Then, in a string of town-hall meetings across Arizona, Georgia, Virginia, and the flat brown counties of central Texas, a new applicant started showing up on the utility docket. It doesn't grow anything. It doesn't employ many people. It arrives as a set of engineering drawings for a windowless building the size of several football fields, and it asks the local water authority a question that sounds simple and isn't: how many million gallons a day can you commit to us, and can you commit them on the hottest day of the year?
The buildings are hyperscale AI data centers. From the highway they look like logistics warehouses — beige, blank, deliberately boring. Inside, they are among the most thermodynamically violent structures humans have ever built: racks of GPUs packed so densely that the heat they throw off would cook the hardware in minutes if it weren't hauled away continuously. Hauling it away is what the water is for.
The debate that has erupted around this is genuinely messy, and both sides have a point. Critics see a private industry quietly commandeering a public resource during a drought. The industry responds — correctly — that its total draw is small next to agriculture's, that the per-query numbers circulating online are wildly overstated, and that new cooling designs are pushing on-site water consumption toward zero. Both of those things can be true at once. What makes the fight matter isn't the national average. It's the local peak, the specific aquifer, the specific August afternoon.
And it arrives at the worst possible moment. The planet is currently losing an estimated 324 billion cubic meters of freshwater every year to unsustainable land use, wetland loss, and the slow continental drying that comes with a destabilized climate. Roughly 2.1 to 2.2 billion people — one in four humans — live without safely managed drinking water at home. About 106 million drink untreated surface water straight from rivers and ponds. In sub-Saharan Africa, nearly 400 million people lack even basic access, and water-related disease still kills around 1,000 children under five every single day.
So here is the strange, hopeful thing about the moment we're in. The same industry now queuing at the utility counter is the one that has made it possible to hear a leak through six feet of asphalt, to see soil moisture from orbit, to design a crystal that pulls drinking water out of desert air using nothing but sunrise. The technology showing up as a new claim on the water is also, increasingly, the way out of the shortage.
This is a tour of both.
Part One: What the Cloud Actually Drinks
For years, the environmental conversation about computing was about carbon. Water was an afterthought, buried in sustainability reports under "operational metrics." That was a mistake, because the physics were never subtle.
Here's how a conventional data center stays alive. Heat from the chips is carried out of the server hall by a closed loop of coolant, which dumps it into a second, open loop — the cooling tower — where water is sprayed into moving air and deliberately allowed to evaporate. It's a spectacularly efficient way to move heat, the same trick your body uses when it sweats. It is also, by definition, consumptive: that water doesn't go back to the river. It goes into the sky. Depending on climate and tuning, this costs between 1 and 9 liters of water per kilowatt-hour of server energy.
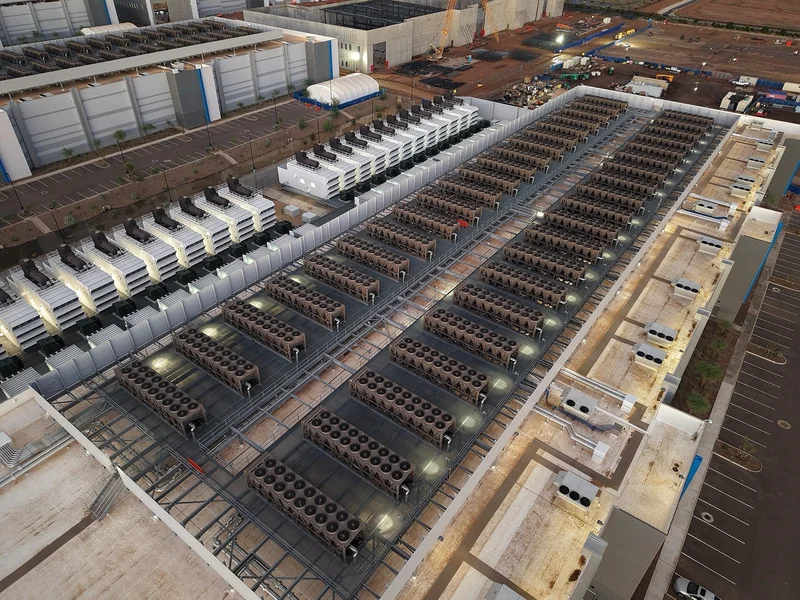
The unglamorous heart of the machine. Every one of those fans exists to move heat from a chip into the sky — and in the conventional design, water is the vehicle.
Multiply that by the buildout.
In 2023, U.S. data centers consumed — meaning evaporated, permanently removed from the local water cycle — roughly 17.4 billion gallons of water on site. That's Lawrence Berkeley National Laboratory's number: 66 billion liters. By 2028, LBNL projects hyperscale facilities alone will consume between 60 and 124 billion liters, or 16 to 33 billion gallons a year.
Separately, and this is a different kind of number entirely, U.S. data centers are projected to require 697 to 1,451 million gallons per day of new water capacity between 2024 and 2030 — comparable to New York City's average daily supply of about 1,000 MGD. That figure is peak infrastructure sizing, not annual throughput. The bill for building it runs an estimated
$10 billion to $58 billion.
Globally, AI demand is on track to account for 4.2 to 6.6 billion cubic meters of water withdrawal by 2027 — that's 1.1 to 1.7 trillion gallons, or roughly the annual water withdrawal of Denmark four to six times over.
The myth, and the part that is real
Stop on those figures for a second, because they look like they contradict each other. Take 1,451 million gallons per day, multiply by 365, and you get 530 billion gallons a year — thirty times the 17.4 billion gallon figure a paragraph earlier.
Nothing is broken; they measure three different things. Withdrawal is water taken out. Consumption is the share that never comes back. Capacity is how big the pipes must be to serve the worst day of the year — a size, not a flow, which is why multiplying it by 365 is like multiplying a stadium's seat count by 365 to estimate attendance. (The full vocabulary, including how each number is actually measured, is in the appendix at the end. Nearly every viral water statistic is either clarified or destroyed by those distinctions.)
With the units straight, the myth-busting goes quickly.
The per-prompt number is overstated. You've seen the claim that a single AI conversation "drinks a bottle of water" — from early modeling that put a 100-word output at 519 milliliters. Newer hardware and better-instrumented facilities put direct on-site consumption closer to 5 to 15 milliliters per prompt. A mouthful, not a bottle. On that narrow question, the industry's correction is right.
The national totals are modest. By 2030, U.S. data centers are projected to account for just 0.6 to 1.1 percent of public water withdrawals. Against agriculture — 70 percent of global freshwater use — the entire digital economy is a rounding error.
And the cross-sector comparisons you've seen are mostly broken. The retort that "one hamburger costs hundreds of gallons" leans on lifecycle footprints dominated by green water — rain that fell on pasture and feed corn anyway. Less than 2 percent of a burger's footprint comes from a public water system. A data center's cooling water is metered, treated, potable municipal supply. Comparing them sets a number about weather beside a number about a utility bill.
So far, so reassuring. Here is the part that survives all of it.
Data centers consume what everyone else merely borrows. Your house returns most of what it withdraws — down the drain, through a treatment plant, back to the river. Urban homes consume just 5 to 15 percent of what they take; averaged across all American public water users, about 12 percent. An evaporative cooling tower consumes 70 to 90 percent, because turning water into vapor is the cooling mechanism. There is no drain.
Which is why the same industry that is 0.6–1.1 percent of public water withdrawals in 2030 is 4 to 7 percent of public water consumption. A data center isn't just a large customer; per gallon delivered, it removes water from the watershed roughly six times faster than the city around it.
And it does so on the worst possible day. Utilities size infrastructure for peak, not average — the 108-degree afternoon when every sprinkler and air conditioner is running. That is precisely when evaporative cooling load goes vertical: peak daily demand can hit six to ten times the annual average. Some planned facilities have requested up to 8 million gallons per day of peak capacity, enough to exhaust a suburban county's entire surplus and the safety margin it keeps for fires and main breaks.
That is the real fight — not the chatbot, but the peak, landing on one specific aquifer, in one specific town, with the cost of the next reservoir socialized across every ratepayer in it.
The engineering answer, and its asterisk
To the industry's credit, the technical response has been fast and real.
| Cooling approach | Typical rack density | Water profile | Cost & practicality |
|---|---|---|---|
|
| 10–30 kW | Very high — 1 to 9 L/kWh evaporated | Cheap to build, enormous water capacity required, brutally exposed to drought |
|
| 30–100 kW | Minimal direct loss; closed loops | Moderate cost, and — crucially — retrofittable into existing halls |
|
| 50–150 kW | Near zero on-site evaporation | Expensive; realistically a new-build or gut-renovation decision |
|
| > 100 kW | Zero water loss; dielectric boiling | Priciest, and the highest-performance option for extreme AI workloads |
An immersion cooling tank with the lid open: server boards submerged in non-conductive dielectric fluid. No fans, no cooling tower, no evaporation. The button, reassuringly, reads DON'T PANIC.
Direct-to-chip cooling bolts a cold plate onto the processor and runs a water-glycol mix through microscopic channels, grabbing heat at the source instead of chilling a whole room around it — cutting cooling energy by up to 30 percent. Immersion cooling goes further and drowns the entire server board in non-conductive dielectric fluid, eliminating the evaporative tower outright. The newest AI-factory reference architectures claim near-zero on-site water by circulating coolant hot enough that plain dry coolers can shed the heat into ambient air.
Here's the asterisk. "Zero-water computing" is a claim about the building, not the system. Thermoelectric power plants are themselves gigantic evaporative machines: in 2023, U.S. data centers consumed roughly 211 billion gallons of indirect water — twelve times their direct footprint — at the plants generating their electricity. Moving evaporation from your cooling tower to a generating station 200 miles away helps the local watershed. It is not the same as making the water disappear.
The most elegant fix is scheduling. Much AI compute — training, batch inference, index rebuilds — is delay-tolerant; it doesn't care whether it runs at 2 p.m. in Phoenix or 4 a.m. in Quebec. Water efficiency varies enormously across space and time, so schedulers that treat watershed stress as a first-class variable alongside price and carbon can push thirsty work toward wet places and cool hours. Nearly free, purely software, available now.
Which is where this story actually begins
Notice what all that engineering implies. Under the Small Bottle, Big Pipe study's optimistic scenario — the industry cutting water intensity by 10 percent a year, which the technologies above make entirely plausible — the capacity requirement falls from 697–1,451 MGD to 227 to 604 MGD. Less than half. On current evidence, AI's water problem is solvable with money and engineering that already exist.
The water system those data centers are plugging into is a different matter.
It loses six billion gallons of treated drinking water every day through cracked pipes. It irrigates deserts with rivers that no longer reach the sea. It purifies water to drinking standard at enormous expense, uses it exactly once — often to flush a toilet — and sends it to the ocean. It leaves two billion people without safe water at home while the technology to fix that sits in laboratories and pilot plants, working.
Hyperscalers did not create any of that. They walked into a building that was already burning and switched on a very bright light.
The rest of this article is about the fire — and about the genuinely extraordinary set of tools that now exist to put it out.
Part Two: The Elephant Nobody Photographs
All of which is important, and none of which is the main event.
Agriculture accounts for roughly 70 to 72 percent of all freshwater withdrawals on Earth. On a withdrawal basis, every data center on the planet is a rounding error next to irrigation. If you want to be honest about water, you have to be honest about food.
A caveat carried over from the last section, because it cuts both ways: the figures below are irrigation numbers, drawn largely from rivers, canals, and farm wells rather than from municipal treatment plants. They are not interchangeable with a data center's potable municipal draw, and I'm not offering them as a rebuttal to it. What they establish is something different — the sheer scale of the pool that water technology has to work on if it's going to matter at all.
In California's Central Valley — a place in more or less permanent hydrological emergency — nut orchards (almonds, pistachios) occupy less than 1 percent of total U.S. cropland and consume roughly 538 billion gallons of water a year. Irrigated corn takes 1.86 trillion gallons. U.S. beef production runs an estimated 2.5 trillion gallons, though that last figure is a full lifecycle footprint dominated by rainfall on pasture and feed crops — the least comparable number of the three, and the one most often misused.
Center-pivot irrigation to the horizon. Every circle is a groundwater withdrawal. This is what 70 percent of global freshwater use actually looks like.
The reason this water moves in such strange directions is a concept called virtual water — the invisible water embedded in a traded good. Ship an almond, and you have shipped the gallons it took to grow it. Ship enough almonds and you have quietly exported a river.
Sometimes this is exactly right. Since 2010, virtual water trade has saved an estimated 475 billion cubic meters globally, by letting arid countries import calories instead of growing them in a desert. It is one of the great underappreciated efficiency mechanisms in the world economy.
And sometimes it runs precisely backward. California's Central Valley, southern Europe, northern India — some of the most water-stressed agricultural regions on the planet — continue to grow and export water-hungry commodities straight through the drought, because the price signals farmers respond to are commodity prices, not aquifer levels. The water is essentially free at the margin. The almond is not. Markets do what markets do.
The technical fixes here are unglamorous, various, and enormously powerful. There are more than most people realize.
1. Precision irrigation — and what it actually costs
Flood irrigation — running water down a furrow and hoping — loses staggering volumes to evaporation and to deep percolation past the root zone. Drip and micro-sprinkler systems, commercialized by Israeli firms like Netafim, deliver metered water and nutrients directly to the roots. Because the water never sits in open air, plants absorb about 95 percent of what is applied, against a fraction of that under flood or sprinkler. Universal adoption could save 50 to 70 percent of agricultural water by 2050. Fifty to seventy percent. Of seventy percent of everything.
Precision irrigation is mostly plumbing: a pecan grower and an NRCS district conservationist inspect the pressure-control valves that meter water into a micro-irrigation system. This — not the emitter — is where the capital cost lives.
So why isn't it everywhere? The honest answer is money, and it is worth walking through the arithmetic, because it explains far more about global water than any technical fact does.
Installing drip runs roughly $1,000 to $3,000 per acre, depending on crop, terrain, filtration needs, and how much automation you buy. Against that, industry and extension estimates put water savings at 30 to 50 percent, fertilizer savings of a similar order (nutrients go into the pipe rather than onto the ground), sharply lower labor, and yield gains of 10 to 30 percent from keeping the root zone at consistent moisture instead of swinging between drowned and parched. Typical payback lands at two to five years on a system with a useful life of ten to twenty.
That is, on paper, an excellent investment. And yet drip irrigation reaches only about 5 percent of farmland worldwide.
The Israel case, and what it actually proves
Israel is the standing demonstration of what happens when a country does deploy at scale. Drip now waters roughly 75 percent of Israeli crops. The national results are genuinely remarkable, and — importantly — they come from OECD and World Bank accounting rather than from anyone's marketing department:
Between 1990 and 2016, Israeli agricultural output grew by nearly
70 percentwhile total agricultural water use stayed essentiallyflat.Between 2000 and 2018, agriculture's share of national freshwater abstraction
halved, from 64 percent to 35 percent.The share of "marginal" water — treated wastewater and saline sources — in agricultural supply rose from
14 percent in the early 1990s to nearly two-thirds by 2020.
Read those three lines together and you have the whole playbook. Israel did not simply grow more food with less water. It grew substantially more food, held water use flat, and progressively swapped the freshwater underneath its agriculture for recycled municipal wastewater — freeing the fresh supply for drinking. Drip irrigation is what made that swap survivable, because recycled water is only agronomically safe when you can place it precisely, below the leaf, in measured doses.
But here is the part that most retellings leave out, and it matters for anyone hoping to copy it. The technology did not deploy itself on ROI alone. Israel priced water, metered it nationally, allocated it by quota, and built the conveyance and treatment infrastructure with public capital. Farmers adopted drip in part because it paid — and in part because water was a metered, priced, rationed input they could not simply take more of.
That is precisely the condition missing almost everywhere else. Recall from earlier in this section that in most irrigating regions, water is effectively free at the margin. If water costs nothing, then the largest line in drip irrigation's return — the water savings — is worth nothing to the farmer, and a $2,000-per-acre investment has to be justified by yield alone. Add the fact that a smallholder working two hectares cannot raise that capital at any interest rate available to them, and the 5 percent adoption figure stops being a mystery.
The lesson is not "drip irrigation works." Everyone knows drip irrigation works. The lesson is that the binding constraint on agricultural water technology is finance and pricing, not engineering — a theme that will recur every remaining section of this article.
2. Seeing the water
The other half of the problem is that nobody could measure field-level consumption cheaply, and you cannot manage what you cannot see. Platforms like OpenET now use NASA and USGS satellite imagery to calculate evapotranspiration — water evaporating from soil plus water transpiring through leaves — field by field, for free, for anyone. That sounds bureaucratic. It's revolutionary. It turns groundwater from an invisible commons into an accountable ledger, and hands the ledger to farmers rather than a distant regulator. Irrigation schedules get optimized; overdrafted aquifers get a budget somebody can verify.
Paired with soil-moisture sensors and variable-rate systems that can vary output across a single center pivot, the same field stops being watered as one uniform block and starts being watered as the dozens of different soils it actually is.
3. The rice problem, and the cheapest fix in agriculture
Here is a technology that costs approximately nothing and almost nobody outside the field has heard of.
Rice is the single most water-intensive staple on Earth, absorbing an estimated 34 to 43 percent of all global irrigation water. The reason is tradition rather than biology: paddies are kept permanently flooded, mostly to suppress weeds. Rice does not actually need standing water to grow.
Alternate Wetting and Drying (AWD) exploits that. Farmers let the field drain until the water table falls a set distance below the surface — monitored with a perforated tube pushed into the mud, which costs about as much as a length of plastic pipe — then re-flood, and repeat. Trials and meta-analyses put irrigation water savings at 15 to 30 percent, with some global analyses higher, without yield loss. Because flooded soil is anaerobic and anaerobic soil breeds methane-producing bacteria, the same practice cuts paddy methane emissions by 30 to 70 percent.
No capital equipment. No new seed. A pipe, a threshold, and a change in habit — applied to more than a third of the world's irrigation water. If any single intervention in this article has an implausible benefit-to-cost ratio, it is this one.
4. Banking water underground
Storage is the other half of scarcity: much of the world's water problem is not annual volume but timing — too much in March, none in August. The twentieth-century answer was concrete, and it is running out of good sites, evaporates from the surface, and silts up.
Managed Aquifer Recharge (MAR) stores water in the ground instead. In the California variant, Flood-MAR, high winter flows that would otherwise run to the sea are deliberately spread across farmland — often dormant orchards and vineyards — and allowed to percolate down into depleted aquifers. The farm becomes the recharge basin. No dam, no reservoir, no evaporation, and the flood peak downstream gets shaved as a bonus.
The economics are startling. Research on California projects puts the median cost of managed recharge at about $410 per acre-foot, against roughly $2,100 per acre-foot for new surface water storage — five times cheaper for the same water. In a state that has spent decades fighting over new dams, the cheapest reservoir turns out to be the one already underneath the Central Valley, waiting to be refilled.
5. And the rest of the toolkit
Several more are moving fast enough to matter within the roadmap at the end of this article: subsurface drip, which buries the emitter line and removes surface evaporation almost entirely; deficit irrigation, which deliberately under-waters certain crops at growth stages where they don't need it, trading a slight yield reduction for a large water one; laser land levelling, an unglamorous South Asian workhorse that cuts irrigation water 20 to 30 percent simply by making a field flat enough to water evenly; drought-tolerant and gene-edited cultivars; and controlled-environment agriculture, which can cut water use by upwards of 90 percent for high-value produce, at a steep energy cost that only makes sense where water is scarcer than power.
One caution on all of the above, in the spirit of this article's appendix: the global irrigation statistics everyone quotes — including the 70 percent figure anchoring this section — rest on thinner empirical foundations than their ubiquity suggests, and a 2025 review found that most citation chains for them dead-end in sources that never contained the numbers. The direction is not in doubt. The decimal places are.
Part Three: The Water That Never Arrives
Before a single drop reaches a farm or a server rack, an appalling amount of it simply vanishes into the ground.
The industry term is non-revenue water: water that has been pumped, treated to drinking standard, pressurized, and then lost through a crack in a buried pipe before anyone drinks it. In the United States, there is a water main break roughly every two minutes, and the country loses somewhere between 1.7 and 2.2 trillion gallons of treated drinking water every year — the Value of Water Campaign puts it at the low end, ASCE at the high end (6 billion gallons a day). Either way it is on the order of 12 to 15 percent of everything the nation's public water systems produce. That is not just wasted water. It's wasted chlorine, wasted filtration, wasted electricity, wasted carbon — the entire cost of purification, poured into the subsoil.
Put that beside the numbers from Part One and the proportions rearrange themselves — and this is a comparison that actually survives scrutiny, because both sides of it are the same quantity: treated potable water, produced by public systems, measured at the point of withdrawal. Even at their projected 2030 withdrawals of 80 to 150 billion gallons a year, U.S. data centers would draw somewhere between a tenth and a twenty-seventh of what the nation's utilities lose through cracked pipes over the same period. The most water-intensive thing in American water infrastructure is American water infrastructure.
(A caution, since this figure is widely mangled: the frequently quoted "900 billion gallons" is the EPA's estimate of leaks inside homes — dripping faucets and running toilets, downstream of the meter — not utility distribution loss. And the 33 trillion gallon figure that sometimes appears in U.S. coverage is the global non-revenue water total. It cannot be American; the entire U.S. public supply only withdraws about 14 trillion gallons a year.)
The fix, pleasingly, uses the same AI that started this story.
A ruptured hydrant venting fully treated, fully paid-for drinking water into the air beside a Florida highway. The visible failures are the cheap ones — the expensive losses never surface at all.
Listening to the pipes. A pressurized pipe with a hole in it makes a sound — a specific, characteristic hiss that propagates through the pipe wall and the surrounding soil. It is also buried under a city, which is a howling mess of traffic, construction, HVAC, and passing trains. Companies like FIDO Tech deploy IoT acoustic sensors across municipal networks and run the audio through models trained to separate a leak's signature from urban noise — not just detecting that a leak exists, but estimating its size and position, so crews can dig once, in the right place, before the street collapses.
Watching from orbit. Then there's the properly science-fictional approach. Asterra uses Synthetic Aperture Radar on low-Earth-orbit satellites — instrumentation originally developed to hunt for subsurface water on Mars — to scan entire cities from space. The radar penetrates asphalt and soil, and the return signal carries a dielectric signature that distinguishes treated drinking water pooling underground from ordinary groundwater. A single pass can prioritize thousands of kilometers of pipe. Utilities have spent a century looking for leaks by walking around at night with a listening stick. Now they get a heat map.
And then there is Tokyo. Which is the part of this story that should be printed and mailed to every water utility on Earth, because it proves the whole thing is possible.
After the Second World War, Tokyo's water network leaked 80 percent of what it carried. Eighty. Four out of five gallons never reached a tap. The city faced explosive population growth with almost no local water resources and no realistic prospect of new supply, so it did the only thing left: it decided to stop losing what it already had.
The campaign took decades and it was ferociously unglamorous. Tokyo systematically replaced aging cast iron distribution mains with ductile iron, and — the crucial move — replaced service pipes, the small connections into individual buildings where most leaks actually occur, with earthquake-resistant stainless steel. It divided its 27,000-kilometer network into thousands of isolated measurement blocks to run Minimum Night Flow analysis: in the dead hours when legitimate consumption falls to near zero, whatever is still flowing is, by definition, leaking. It sent crews out with subsurface radar. And when that wasn't enough, it injected chemically inert helium into suspect mains and sniffed for it at street level as the gas escaped through the fracture and percolated up through the soil.
Today Tokyo's leakage rate is 3.0 to 3.2 percent. From 80 to 3.
The city saves nearly $480 million a year in avoided treatment and pumping, and cuts 54,000 tonnes of CO₂ annually as a side effect. There is no exotic materials science here, no breakthrough, no venture round. It is just an enormous quantity of patient, competent engineering sustained across generations — which is, uncomfortably, the hardest technology of all to acquire.
Part Four: The Circular City
The 20th-century urban water model is a straight line: take water from a distant river, purify it to drinking standard at great expense, use it exactly once — often to flush a toilet — and send it to the ocean. Every part of that sentence is now understood to be a mistake.
The alternative is a loop. And the two best demonstrations of it in America could not be more different in scale.
Las Vegas: the city that never loses a drop indoors
Las Vegas sits in the Mojave under four inches of annual rainfall, with the most legally constrained water allocation of any major American city, and it has spent the last three decades quietly becoming one of the most water-sophisticated places on Earth.
The Southern Nevada Water Authority captures and recycles 99 percent of all water used indoors across the region. When you shower in a Strip mega-resort, that water is collected, treated to a high standard, and returned to the Colorado River via the Las Vegas Wash, flowing back into Lake Mead. Because Nevada earns return-flow credits for every gallon it puts back, indoor use is effectively a closed loop: the city can wash, flush, and fountain more or less indefinitely without touching its federal allocation.
Which produces the most counterintuitive fact in American water policy. The dancing fountains at the Bellagio are not the problem. Lawns are. Water used indoors comes back; water sprayed on a lawn in 110-degree heat evaporates and is gone forever. Vegas figured this out early, and has been paying people to tear out grass ever since.
Lake Mead's "bathtub ring" — the pale mineral band marking where the surface used to be. Las Vegas draws its water from this reservoir, and returns nearly every indoor drop of it.
San Francisco: the building as a water utility
Where Las Vegas went big, San Francisco went small — extremely small.
A 2015 city ordinance required new buildings over 100,000 square feet to install on-site water recycling. That single line of municipal code ignited an industry. Startups like Epic Cleantec now turn individual skyscrapers into self-contained treatment plants. Inside the 61-story Salesforce Tower, Epic runs the largest on-site commercial blackwater recycling system in the United States — blackwater meaning, to be direct about it, everything, including the sewage.
The building captures its own toilet, sink, and shower flows, runs them through membrane filtration, ultraviolet disinfection, and chlorination, and returns up to 30,000 gallons a day for cooling towers and toilet flushing. The system recycles up to 95 percent of the building's wastewater, offsets 7.8 million gallons of potable demand a year, and pays for itself in three to seven years. It also captures solids for conversion into sterile soil amendment and pulls waste heat out of the wastewater stream on the way through.
The strategic insight here is about civil engineering, not chemistry. The "correct" municipal answer to reuse is a second citywide network of purple pipes carrying recycled water — which means tearing up every street in a dense city at multi-billion-dollar cost and decade-long timelines. Decentralization routes around that entirely. Each building manages its own hydrology. No streets required.
That leaves one obstacle, and it is not technical. It's the yuck factor. Epic's response was to lean all the way in: they brewed an actual beer, Epic OneWater Brew, from purified graywater sourced from a luxury apartment building, and handed it to people. Reportedly it's fine. That is roughly the entire public-health communication strategy for the next thirty years, and it may be the single hardest engineering problem in this article.
Drinking it directly
The endgame of reuse has an unlovely name — Direct Potable Reuse — and California just legalized the most rigorous version of it in the world.
In December 2023, the State Water Resources Control Board adopted DPR regulations that took effect in October 2024. DPR means treated municipal wastewater can go directly into a public drinking water system, without first spending months sitting in an aquifer or reservoir as an "environmental buffer." The buffer was never really doing purification work; it was doing psychological and regulatory work — providing time to detect a failure. Removing it means the engineering has to be flawless, continuously, forever.
So California specified a treatment train with no gaps:
-
Ozone with Biologically Activated Carbon (O₃/BAC).Ozone chemically oxidizes contaminants; a cultivated bacterial film on the carbon then eats the low-molecular-weight organic fragments left behind. This flattens the chemical peaks in the incoming water and stops the downstream membranes from fouling.
-
Reverse Osmosis.Physical separation at molecular scale — total organic carbon, viruses, and salts stripped out, at a mandated average rejection rate above 99 percent.
-
UV Advanced Oxidation.A final chemical kill step that destroys the trace organics small enough to slip through RO, including industrial solvents like 1,4-dioxane.
Then come the pathogen requirements, which are the most stringent in the global water industry. Performance is measured in Log Reduction Values, where each "log" is another factor of ten. California requires 20-log reduction for enteric viruses. That is a hundred-quintillion-fold reduction — a one followed by twenty zeros. Plus 14-log for Giardia cysts and 15-log for Cryptosporidium oocysts. Continuous online monitoring watches every critical parameter, and the instant any of them drifts, the water is automatically diverted away from the drinking supply.
You are, statistically, far more likely to be harmed by the pipe between the plant and your kitchen than by anything the plant sends into it.
Shrinking the plant itself
A conventional advanced wastewater plant occupies a district. Those dozens of circles are secondary clarifiers — tanks whose entire job is to wait while sludge slowly settles. The next generation of biology deletes them.
Meanwhile, the treatment plants are getting radically smaller, thanks to a bacterial trick discovered at Delft University of Technology.
Conventional activated sludge — the workhorse of wastewater treatment for a century — needs sprawling acreage, because the water has to be walked through separate anaerobic, anoxic, and aerobic tanks in sequence, then parked in enormous clarifiers while fluffy microbial "flocs" slowly settle out. It works. It occupies a lot of extremely valuable urban land.
The Nereda process, built on Aerobic Granular Sludge, persuades those same purifying bacteria to grow as dense, fast-settling granules instead of fluff. Each granule self-organizes into layers, like an onion: the oxygenated outer shell handles nitrification while the oxygen-starved core simultaneously performs denitrification. Every reaction that used to require its own tank now happens at once, at different depths of a single grain, inside one batch reactor.
The result is a plant with up to 75 percent less footprint and up to 50 percent less energy consumption, with the secondary clarifiers and heavy recycle pumping deleted entirely. Two decades of activated-sludge civil engineering, replaced by better-behaved bacteria.
Part Five: Harvesting the Sky, Mining the Sea
When the rivers are allocated and the aquifers are drawn down, there are exactly two reservoirs left that are effectively unlimited. One is over your head. The other starts at the beach.
The molecular sponge
There is nearly as much water suspended in Earth's atmosphere as in all of its rivers and lakes combined. Getting it out has always been the problem. The brute-force method — chill air below its dew point until water condenses — works fine in Miami and fails completely in the places that actually need it, because in a desert at 10 percent humidity, the dew point is so low that mechanical cooling costs more energy than the water could possibly be worth.
The way around this is chemistry, and the person who found it is Omar Yaghi at UC Berkeley, inventor of metal-organic frameworks.
The crystal structure of MOF-5, the archetype of the class. Metal clusters at the corners, organic struts between them, and — crucially — that enormous void in the middle. Water goes there.
MOFs are crystalline sponges built at the molecular level: inorganic metal clusters joined by organic linker molecules into a rigid, absurdly porous scaffold. The internal surface area is hard to convey — a gram of the stuff can unfold to the area of a small field. More importantly, the geometry can be tuned, so a framework can be designed to grab one specific molecule with high affinity. Yaghi's team designed for water vapor, down to relative humidity as low as 10 percent.
The device that resulted, built around an aluminum framework called MOF-303, has no moving parts and needs no power at all. Overnight, when desert air cools and its relative humidity climbs, the MOF bed silently loads itself with water. As the sun comes up, ambient heat drives the vapor back out of the framework in concentrated form, into an insulated condenser, where it beads into pure distilled water.
Field-tested in Death Valley — an environment chosen specifically because it is the least plausible place on Earth to find water — an optimized harvester produced 210 to 285 grams of water per kilogram of MOF per day with zero external energy input. Add a small solar panel to drive a fan and force airflow, and an electrified version can cycle several times a day, yielding over 5 liters daily from just 200 grams of material.
Think about what that implies. Not a bigger pipe network — no pipe network. Off-grid, decentralized water for communities that centralized infrastructure was never going to reach, made from air and sunrise.
The nation that made water from the sea and then had extra
For coastal regions, the ocean is infinite and merely inconvenient.
Israel is the proof of concept for solving that inconvenience at national scale. A country defined for its entire modern history by water anxiety built five large Mediterranean seawater desalination plants and turned itself into a water exporter. Desalination now supplies 60 to 80 percent of Israeli drinking water.
The less-publicized half is more impressive. Israel treats and reuses roughly 90 percent of its municipal wastewater, most of it piped to agricultural irrigation in the Negev. For comparison: Spain reuses about 20 percent, and the United States somewhere between 1 and 10. It is a genuinely circular national water economy, and the technology involved is far less exotic than the political will required to build it.
Inside a seawater reverse osmosis hall. The green pipes carry the feed; the blue racks are pressure vessels, each holding membranes that separate salt from water one molecule at a time.
Desalination used to be a punchline for exactly one reason: energy. Forcing seawater through a membrane fine enough to strain out salt ions requires brutal pressure, and pressure is electricity.
The breakthrough was almost embarrassingly mechanical. In a reverse osmosis plant, the rejected brine exits the membrane still at nearly full pressure — an enormous stream of hydraulic energy that early plants simply threw away through a valve. Energy Recovery Devices like the ERI Pressure Exchanger capture that pressure and transfer it directly into the incoming seawater feed with near-perfect efficiency, essentially a hydraulic flywheel. Plant power consumption fell by up to 60 percent. Desalination went from a last resort to a line item.
And the materials are still improving:
Aquaporin membranes cheat by using biology. Living cells move water across their membranes through dedicated protein channels called aquaporins — molecular turnstiles that pass water at up to a billion molecules per second while categorically refusing salts and contaminants. "Aquaporin Inside" technology embeds the actual proteins into a synthetic polyamide thin-film composite. The resulting membranes run at dramatically lower pressure, with claims of up to 70 percent less energy than competing filtration, at higher selectivity. Four billion years of protein engineering, licensed.
MXenes, a family of two-dimensional nanomaterials, offer highly ordered nanochannels with exceptional ion selectivity — useful not only for desalination but for stripping complex industrial pollutants that conventional membranes struggle with.
Solar hydrogels attack the problem from the opposite direction. Instead of pressure, use sunlight — but instead of heating an entire tank of water, engineer a 3D hierarchical hydrogel or aerogel that concentrates photothermal heat precisely at the air-water interface, where evaporation actually happens. By restructuring how water is held inside the polymer network, these evaporators lower the effective enthalpy of vaporization and reach evaporation rates above 3.0 to 3.6 kg m⁻² h⁻¹ under one-sun illumination — beating limits that were long assumed to be theoretical ceilings.
Brine is not waste. Brine is ore.
The oldest complaint about desalination is what comes out the back: hypersaline brine, traditionally pumped back into the sea, where it sinks, pools, and can suffocate benthic ecosystems.
The emerging view is that this framing was a category error. That brine is a concentrated solution of dissolved minerals — which is, definitionally, an ore body that has already been mined, crushed, and dissolved for you at no cost.
Brine mining goes after it. Using techniques like bipolar membrane electrodialysis, engineers split the concentrate into acid and base streams, then use those to selectively precipitate out valuable products: magnesium, calcium, potassium, and — the prize — lithium, the strategic bottleneck of the entire battery and grid-storage economy.
The economics get genuinely weird from there. A plant that extracts calcium and CO₂ from its own brine can manufacture the process chemicals it needs to run itself, closing an internal loop. Do that at scale and a desalination facility stops being a costly water utility with an environmental liability attached, and becomes a dual-revenue minerals operation that produces drinking water as a co-product — potentially self-sustaining, potentially carbon-negative.
Killing what cannot be filtered
One class of contaminant refuses all of the above. PFAS — per- and polyfluoroalkyl substances, the "forever chemicals" — are built around carbon-fluorine bonds, among the strongest in organic chemistry. Biology can't break them. Ordinary oxidation can't break them. Filtration merely relocates them: activated carbon captures PFAS beautifully, and then you own a hazardous saturated filter and the same problem in a smaller box.
They have to be destroyed, which means going somewhere chemistry gets strange. Supercritical Water Oxidation takes wastewater past water's critical point — above 374 °C and 221 bar — where it stops being recognizably liquid or gas and becomes something else entirely: a dense fluid in which organic compounds dissolve freely and oxidation runs with terrifying efficiency. In that environment, carbon-fluorine bonds shatter. The PFAS molecule is not captured, sequestered, or transferred. It is mineralized out of existence, leaving clean water, inert salts, and recoverable heat.
Part Six: The Gap Between the Lab and the Tap
Now the deflating part.
Every technology above exists. Several are deployed at commercial scale today. And none of them matter if the pipe carrying the result is 90 years old and made of lead.
The American Society of Civil Engineers' 2025 Report Card gave U.S. infrastructure an overall grade of C — the highest since the report began in 1998, buoyed by the capital surge from the 2021 Infrastructure Investment and Jobs Act. That's the good news, and it is real.
Water did not do as well as the headline. Drinking water earned a C−, wastewater a D+, and stormwater a D.
The bad news is the arithmetic underneath. Across all eighteen infrastructure categories, ASCE puts the ten-year funding gap at roughly $3.6 to $3.7 trillion — the figure varies slightly between ASCE's own documents — between what's currently planned and what's needed simply to hold the system in a state of good repair. Not to modernize. To maintain.
Water's own share of that hole is smaller but still enormous, and it is the number that matters here. The Value of Water Campaign and ASCE put the gap between water infrastructure needs and actual spending at $91 billion in 2024 alone, growing to a cumulative shortfall of more than $2 trillion by 2043 on current trends. ASCE separately estimates that drinking water systems alone need over $625 billion across the next twenty years. Lead service line replacement, combined sewer overflow remediation, climate-resilient treatment plants — all of it competes for money that isn't allocated.
That deficit is not free. Continuing merely to invest at current IIJA levels — not closing the gap, just not backsliding — is projected to save the average household about $6,745 cumulatively over two decades and preserve more than 200,000 jobs by 2043.
And the upside case, if the gap were actually closed, is genuinely startling. A 2020 analysis by the Value of Water Campaign and ASCE — modeled by EBP, Downstream Strategies, and the University of Maryland's INFORUM group — found that fully funding water infrastructure would generate a $4.5 trillion gain in GDP, create nearly 800,000 new jobs, and raise annual household disposable income by more than $2,000.
Three honest caveats, since these are the numbers most often quoted without them. The $4.5 trillion is cumulative across twenty years (2020–2039, in 2019 dollars), not annual — the model's own table puts it at $4,480 billion over the full period. The jobs and the $2,000 are figures for the end of that ramp, the year 2039, not gains that arrive on day one; most of the benefit accrues in the second decade. And all of it is conditional on spending roughly $109 billion a year above current levels — $2.2 trillion in additional investment over twenty years, against a baseline in which the U.S. was meeting just
37 percentof its capital water needs. The 2024 update describes that level of commitment as, four years on, still "largely out of reach."
It is a statement about what the money would buy, not a forecast of what will happen. Six of those twenty years have already gone by.
Which reframes the whole AI-water debate, incidentally. The most useful thing the technology industry could do for the world's water is not merely to make its own cooling loops drier. It's that hyperscalers arriving in a town with capital, urgency, and a direct interest in the reliability of the local water system are the first entity in decades with both the money and the motive to actually rebuild it. Whether that happens — whether the new demand pays for the upgrade or just consumes the remaining slack — is a policy choice, not a technical one. It is being made right now, one municipal utility agreement at a time.
The Fifty-Year Roadmap
If the technologies in this article were deployed with the same ferocity and capital currently aimed at AI itself, here's a plausible sequence.
| Phase | Timeline | Core focus | Key milestones |
|---|---|---|---|
|
| 2026–2035 | Fix the foundation; smart grids; AI integration | Global rollout of SAR-satellite and AI acoustic leak detection, targeting sub-10% non-revenue water in developed nations. Universal water-aware workload scheduling shifting AI compute to water-abundant regions and hours. California's DPR framework replicated across arid U.S. states and internationally. Federal funding pivots from like-for-like replacement to climate-resilient rebuild. |
|
| 2036–2045 | Circular cities; waste becomes commodity | On-site blackwater recycling written into building code for new commercial high-rises globally, on the San Francisco model. Wastewater treatment transitions to aerobic granular sludge. Brine mining reaches economic viability; desalination plants adopt dual-revenue water-and-minerals models. PFAS eliminated from municipal systems via distributed SCWO. |
|
| 2046–2055 | Off-grid independence; agricultural revolution | Mass manufacturing of MOF atmospheric harvesters delivers water independence to arid off-grid communities with no piped infrastructure. Flood irrigation phased out entirely; AI-managed drip irrigation driven by satellite evapotranspiration data becomes the global default, alongside Israeli-style wastewater reuse. Drought-engineered crops reshape the virtual water trade. |
|
| 2056–2076 | Total integration; climate immunity | Megacities reach water neutrality — closed-loop systems recycling every municipal and industrial drop indefinitely. Desalination runs entirely on renewables, with aquaporin and MXene membranes pushing energy costs toward the thermodynamic floor. Global water scarcity index collapses. Water is managed not as a finite consumable but as a precision-engineered, infinitely renewable molecular asset. |
The Molecular Economy of Water
The data centers rising out of the desert didn't create the water crisis. They did something arguably more useful: they made it legible. A 200-megawatt facility asking a small county for eight million gallons on a summer afternoon is a question the 20th-century water grid cannot answer without revealing exactly how thin its margins already were — margins eroded by a century of pumping from ever-more-distant rivers, using each drop precisely once, and calling the result waste.
What's replacing it is a shift in scale of attention. We are moving out of an era of bulk extraction and into one of molecular management. A metal-organic framework selecting individual water molecules out of Death Valley air. An aquaporin protein passing a billion molecules a second while turning away every ion. A bacterial granule running nitrification and denitrification simultaneously at different depths of a single grain. Supercritical water tearing apart a carbon-fluorine bond. An algorithm identifying the acoustic frequency of a crack in a buried pipe, three streets over, before anyone notices the pressure drop.
Every one of those tools exists. That's the part worth sitting with. The remaining problem is not scientific — it's deployment, capital allocation, and regulatory nerve. The water funding gap — $91 billion a year and widening — has to close. The yuck factor has to lose. The virtual water trade has to stop quietly draining the driest places on Earth to grow snacks for wetter ones.
None of that is impossible. Tokyo went from losing 80 percent of its water to losing 3, using nothing more exotic than stainless steel, night-flow math, and fifty years of refusing to accept the leak. That is the actual technology this century needs, and it is entirely available.
The thirst is real. So is the answer. What's undecided is whether we fund the second one with the same fervor we're currently funding the first.
📘 Appendix: How to Read a Water Number
Skippable if you already know this. Worth four minutes if you don't, because essentially every viral water statistic is either clarified or destroyed by the distinctions below.
The big three
Withdrawal — how much water you take out of a river, an aquifer, or a municipal main. This is the number utilities meter, bill, and plan around.
Consumption — how much of that water never comes back. Evaporated into the sky, locked into a product, drunk by a cow. Officially: water permanently removed from the immediate water cycle.
Capacity — how big the pipes, pumps, and treatment plants must be to serve you on your worst day. Capacity is a size, not a flow. Never multiply it by 365.
Think of it as a bank account. Withdrawal is what you pull out of the ATM. Consumption is what you actually spend and never get back. Capacity is the daily withdrawal limit on the card. Three different numbers about the same account, and quoting one while meaning another is how most water arguments go wrong.
The ratio that explains everything
Consumptive ratio — consumption ÷ withdrawal. The share that doesn't come back.
This single number is why data centers are contentious. Your house consumes only 5–15% of what it withdraws; the rest goes down the drain, through a treatment plant, and back to the river. An office building, ~10%. Averaged across all American public water users, ~12%.
An evaporative cooling tower consumes 70–90%, because turning water into vapor is the cooling mechanism. There is no drain. A data center is therefore not just a big customer — per gallon delivered, it removes water from the watershed roughly six times faster than the city around it.
Whose water is it? (Scopes)
Borrowed from carbon accounting, and the single most common source of bogus comparisons:
| Scope | What it covers | For a data center |
|---|---|---|
|
| Direct, on-site | Cooling tower evaporation |
|
| Making the electricity you bought | Evaporation at the power plant |
|
| Everything else upstream | Chip fabrication, construction |
A headline saying "AI uses X gallons" may mean any combination of these. Scope 2 is typically 12× larger than Scope 1 for data centers. Scope 3 is rarely counted at all, because nobody has reliable data.
Green, blue, and grey water
Blue water — liquid water drawn from rivers, aquifers, or pipes. The kind you can run out of.
Green water — rainwater sitting in soil, used by plants where it fell. It would have rained anyway.
Grey water (in footprint accounting) — a hypothetical volume needed to dilute pollution to safe levels. Not water anyone actually moves. Confusingly, plumbers use "greywater" to mean used sink and shower water — a completely different meaning, and the one used later in this article.
This is the trapdoor under the famous hamburger statistic. A beef water footprint is a lifecycle figure dominated by green water — rain falling on pasture and feed corn. Less than 2% of it comes from a public water system. Setting it beside a data center's metered, treated, potable municipal draw compares a number about weather to a number about a utility bill.
Other terms you'll meet
Peak day / peaking factor — the ratio of the busiest day to the average day. Infrastructure is sized for peaks, which is why an operation with a modest annual total can still overwhelm a small utility.
Non-revenue water (NRW) — water treated to drinking standard, pumped, then lost to leaks, theft, or meter error before anyone is billed for it.
WUE (Water Usage Effectiveness) — the data center industry's efficiency metric: liters of water per kilowatt-hour of IT energy. Site WUE counts only on-site water; source WUE includes the power plant.
Potable vs. reclaimed — drinking-quality water versus treated non-potable supply. Which one a facility uses matters enormously, and is frequently omitted.
Evapotranspiration (ET) — evaporation from soil plus transpiration through leaves. The standard measure of what a crop actually consumes.
Units cheat sheet
| Unit | Equals |
|---|---|
| 1 gallon | 3.79 liters |
| 1 cubic meter | 264 gallons (1,000 liters) |
| 1 MGD | 1 million gallons per day |
| 1 billion gallons/year | ~2.74 MGD |
| 1 acre-foot | 325,851 gallons — about a year for two or three households |
How these numbers are actually produced
Worth knowing, because the confidence of a statistic rarely matches the confidence of its measurement:
- Withdrawal is metered.It's the most reliable class of water number, which is exactly why utilities plan with it.
- Consumption is almost never metered.It is inferred — withdrawal minus return flow, or estimated by applying a consumptive ratio. Reasonable, but an estimate.
- Scope 2 water is modeled, not measured anywhere.LBNL derived it by mapping each data center to its regional grid, then to individual power plants' reported water use — arriving at 4.52 liters per kWh nationally. No meter reads this.
- Agricultural footprints are lifecycle models, dominated by rainfall assumptions, with wide error bars.
- Peak water use is usually not disclosed at all.Operators publish annual totals. This is precisely the gap the- Small Bottle, Big Piperesearchers argue should be closed.
Which is why a claim like "one AI prompt costs exactly 519 milliliters" deserves suspicion — not because it's malicious, but because that precision cannot survive the measurement chain behind it.
Three questions for any water statistic
- Withdrawal, consumption, or capacity?
- Which scopes — and is it green water or blue?
- Measured, or modeled?
Most water claims that sound shocking fail at least one of these. The ones that survive all three are worth taking seriously — and several in this article do.
Back to the numbers. You never multiply capacity by 365, any more than you'd multiply a stadium's seat count by 365 to estimate annual attendance. Capacity is a size, not a flow. The 697–1,451 MGD figure comes from a 2026 study out of UC Riverside and Caltech with the wonderfully apt title "Small Bottle, Big Pipe" — the whole argument being that data centers drink a modest amount overall while requiring an enormous pipe to drink it through. Those same researchers put data centers' actual 2030 water flows at 80 to 150 billion gallons of withdrawal and 60 to 110 billion gallons of consumption per year. That's an average of roughly 220 to 410 MGD — about a third of the peak capacity that must be built to serve it.
So: LBNL's 17.4 billion gallons is measured consumption in 2023. The 80–150 billion gallons is projected withdrawal in 2030. And 697–1,451 MGD is peak capacity to be built by 2030. Three units, three dates, three meanings. Quote them in a row without labels — as nearly everyone does, and as an earlier draft of this article did — and you produce a paragraph that reads as alarming and parses as nonsense.
Image Credits
All images sourced from Wikimedia Commons under open licenses. Attribution required for CC BY-SA images if reproduced.
| # | Image | Credit | License |
|---|---|---|---|
| 1 | Rsparks3 | CC0 | |
| 2 | Rsparks3 | CC0 | |
| 3 | Rolf Brink | CC BY-SA 4.0 | |
| 4 | John A. Kelley, USDA NRCS | Public domain | |
| 5 | Kiran891 | CC BY-SA 4.0 | |
| 6 | Christian David | CC BY-SA 4.0 | |
| 7 | Sdkb | CC BY-SA 4.0 | |
| 8 | Axs154 | CC BY-SA 4.0 | |
| 9 | James Grellier | CC BY-SA 3.0 | |
| 10 | Indrajit Das | CC BY-SA 3.0 | |
| 11 | Lance Cheung / USDA | CC BY 2.0 |
Sources & Further Reading
Primary sources for the data center water figures. Every number in Part One traces to one of these two studies; both were read in full rather than via secondary coverage.
- A.Shehabi, Smith, Hubbard, Newkirk, Lei, Siddik, Holecek, Koomey, Masanet & Sartor —- 2024 United States Data Center Energy Usage Report, Lawrence Berkeley National Laboratory, December 2024. Source of the 2023 direct consumption figure (66 billion liters), the indirect figure (~800 billion liters), and the 2028 hyperscale projection (60–124 billion liters). Defines consumption as "the amount of withdrawn water that is permanently removed from the immediate water cycle." — https://eta.lbl.gov/publications/2024-lbnl-data-center-energy-usage-report
-
B.Han, Li, Wierman & Ren —- Small Bottle, Big Pipe: Quantifying and Addressing the Impact of Data Centers on Public Water Systems, arXiv:2603.02705 (UC Riverside, RIT, Caltech), 2026. Source of the 697–1,451 MGD new-capacity projection, the 227–604 MGD optimistic scenario, the $10–58 billion valuation, the 2030 withdrawal/consumption ranges, the 0.6–1.1% / 4–7% public-system shares, the consumptive-ratio table, and the critique of cross-sector water-footprint comparisons. — https://arxiv.org/abs/2603.02705
-
World Bank — World Annual Fresh Water Losses Could Supply 280 Million People— https://www.worldbank.org/en/news/press-release/2025/11/04/world-annual-fresh-water-losses-could-supply-280-million-people
- LIFE NGO — The global water crisis: key figures and concrete solutions— https://life-ong.org/en-us/actualites/crise-eau-potable-monde-2026
- Gitnux — Global Water Scarcity: 2026 Verified Stats & Trends— https://gitnux.org/global-water-scarcity-statistics/
- United Nations — Water— https://www.un.org/en/global-issues/water
- Li, Yang, Islam & Ren — Making AI Less "Thirsty": Uncovering and Addressing the Secret Water Footprint of AI Models, arXiv — https://arxiv.org/abs/2304.03271
- FWPCOA — Myths vs. Reality: Data Centers and Water Usage— https://www.fwpcoa.org/content.aspx?page_id=5&club_id=859275&item_id=130961
- Forbes — How Much Water Does AI Use? The $58 Billion Risk— https://www.forbes.com/sites/robertszczerba/2026/07/21/how-much-water-does-ai-use-the-58-billion-risk/
- CBS News — How much water does AI really use?— https://www.cbsnews.com/projects/2026/how-much-water-ai-uses/
- EESI — Data Centers and Water Consumption— https://www.eesi.org/articles/view/data-centers-and-water-consumption
- Han, Li, Wierman & Ren — Small Bottle, Big Pipe, arXiv:2603.02705 — https://arxiv.org/abs/2603.02705
- Shehabi et al. — 2024 United States Data Center Energy Usage Report, LBNL — https://eta.lbl.gov/publications/2024-lbnl-data-center-energy-usage-report
- GBC Engineers — Direct-to-Chip vs Immersion Cooling— https://gbc-engineers.com/news/direct-to-chip-vs-immersion-cooling
- Supermicro — What Is Direct-to-Chip Liquid Cooling?— https://www.supermicro.com/en/glossary/direct-to-chip-liquid-cooling
- Northwestern Now — A closer look at how Israel manages its precious water resources— https://news.northwestern.edu/stories/2022/10/global-engineering-trek-israel-water
- OpenET — Open-Source Transparent Water Management Data— https://etdata.org/
- FIDO Tech — Cutting-edge water leak detection technology— https://fido.tech/fido-ai/
- ASTERRA — Satellite Leak Detection 2023–2025 Review, North Kingstown, RI— https://www.northkingstownri.gov/DocumentCenter/View/12371/Executive-Summary-Report-ASTERRA-Satellite-Leak-Detection-2023-2025-Review
- JICA — Reducing Non-Revenue Water: Japan's Experiences on Water Supply Development— https://www.jica.go.jp/english/our_work/thematic_issues/water/c8h0vm0000fgpuk7-att/materials_01_06.pdf
- Tokyo Metropolitan Government — Perpetual Challenge for Zero Non-Revenue Water Rate— https://www.english.metro.tokyo.lg.jp/documents/d/english/o2-2
- Outokumpu — The secret to Tokyo's low water leakage rate— https://www.outokumpu.com/en/expertise/2021/the-secret-to-tokyos-low-water-leakage-rate
- Southern Nevada Water Authority — Where Your Water Comes From— https://www.snwa.com/water-resources/where-water-comes-from/
- Yale E360 — Beyond the Yuck Factor: Cities Turn to 'Extreme' Water Recycling— https://e360.yale.edu/features/on-site-distributed-premise-graywater-blackwater-recycling
- SFPUC — Onsite Water Reuse Lessons Learned— https://www.sfpuc.gov/sites/default/files/documents/OnsiteWaterReuse_LessonsLearned_2024.pdf
- Epic Cleantec — The Cost Savings and ROI of Onsite Water Reuse— https://epiccleantec.com/blog/cost-savings-roi-of-onsite-water-reuse-systems
- Stanford Water in the West — Extreme Decentralized Water Treatment— https://waterinthewest.stanford.edu/sites/default/files/Extreme_Decentralized_Water_Treatment.pdf
- WateReuse — California's Direct Potable Reuse Regulations: Major Provisions— https://watereuse.org/wp-content/uploads/2024/09/2024-WRCA-DPR-Overview-v4.pdf
- California State Water Resources Control Board — Regulating Direct Potable Reuse in California— https://www.waterboards.ca.gov/drinking_water/certlic/drinkingwater/direct_potable_reuse.html
- US EPA — Summary of California's Water Reuse Regulation for Direct Potable Water Reuse— https://www.epa.gov/waterreuse/summary-californias-water-reuse-guideline-or-regulation-direct-potable-water-reuse
- Aqua-Aerobic Systems — AquaNereda Aerobic Granular Sludge Technology— https://aqua-aerobic.com/downloads/AquaNereda_AGS_Technology_WhitePaper_2019.pdf
- Haskoning — Nereda Aerobic Granular Sludge Technology: Sustainability— https://nereda.haskoning.com/en/technology/advantages/sustainable
- Yaghi Lab, UC Berkeley — MOF water harvester produces water from Death Valley desert air in ambient sunlight— https://yaghi.berkeley.edu/pdfPublications/23MOFwaterdevice.pdf
- ACS Central Science — Metal–Organic Frameworks for Water Harvesting from Air, Anywhere, Anytime— https://pubs.acs.org/doi/10.1021/acscentsci.0c00678
- US EPA — From Water Stressed to Water Secure: Lessons from Israel's Water Reuse Approach— https://www.epa.gov/system/files/documents/2023-03/From%20Water%20Stressed%20to%20Water%20Secure%20-%20Lessons%20from%20Israel%27s%20Water%20Reuse%20Approach.pdf
- Times of Israel — Israeli desalination, wastewater treatment becomes global model for water scarcity— https://www.timesofisrael.com/israeli-desalination-wastewater-treatment-becomes-global-model-for-water-scarcity/
- Energy Recovery — PX Pressure Exchanger Technology— https://energyrecovery.com/px-technology/
- PR Newswire — Frost & Sullivan Applauds Aquaporin A/S for its Unique Biomimetic Membranes— https://www.prnewswire.com/news-releases/frost--sullivan-applauds-aquaporin-as-for-its-unique-biomimetic-membranes---the-aquaporin-inside-technology-169274256.html
- ACS I&EC Research — Novel Commercial Aquaporin Flat-Sheet Membrane for Forward Osmosis— https://pubs.acs.org/doi/10.1021/acs.iecr.7b02368
- Drexel Nanomaterials Institute — MXenes for Water Purification— https://research.coe.drexel.edu/mse/nanomaterials/2022/07/mxenes-for-water-purification/
- MDPI Processes — Hydrogel-Based Solar Interfacial Evaporators: Design, Performance, and Applications— https://www.mdpi.com/2227-9717/13/12/3921
- RMI — Harnessing Carbon Removal Opportunities in Desalination— https://rmi.org/resources/harnessing-carbon-removal-opportunities-in-desalination/
- IDE Technologies — Desalination Brine Mining for Sustainability— https://ide-tech.com/en/blog/from-sustainable-to-self-sustained-the-future-of-seawater-desalination-merges-sustainability-with-profitability/
- LCCMR — Breaking the PFAS Cycle with a Full-Scale Demonstration (SCWO)— https://www.lccmr.mn.gov/projects/2024/approved_work_plans/2024-257_approved_workplan.pdf
- ASCE — 2025 Report Card for America's Infrastructure— https://www.asce.org/publications-and-news/civil-engineering-source/society-news/article/2025/03/25/asce-report-card-gives-us-infrastructure-highest-ever-c-grade
- US Water Alliance — Bridging the Gap: The Economic Benefits of Investing in Water(2024) — source of the $91 billion 2024 gap, >$2 trillion cumulative by 2043, $6,745 household savings, and the "largely out of reach" assessment — https://uswateralliance.org/wp-content/uploads/2024/05/Bridging-the-Gap%E2%80%94The-Economic-Benefits-of-Investing-in-Water.pdf
- Value of Water Campaign & ASCE — The Economic Benefits of Investing in Water Infrastructure: How a Failure to Act Would Affect the U.S. Economic Recovery(August 2020; modeling by EBP, Downstream Strategies, and INFORUM at the University of Maryland) — the primary source of the $4.5 trillion GDP, 800,000 jobs, $2,000 disposable-income, and $109 billion/year figures. Figure 11 gives the cumulative 2020–2039 totals in 2019 dollars — https://www.uswateralliance.org/wp-content/uploads/2023/09/The-Economic-Benefits-of-Investing-in-Water-Infrastructure_final.pdf
- USGS — Estimated Use of Water in the United States in 2015, Circular 1441 — source of the 322 billion gal/day total-withdrawal and 39 billion gal/day public-supply denominators — https://pubs.usgs.gov/publication/cir1441
- USGS — Summary of Estimated Water Use in the United States in 2015— https://pubs.usgs.gov/fs/2018/3035/fs20183035.pdf
- USGS — Water use across the conterminous United States, water years 2010–20— https://pubs.usgs.gov/publication/pp1894D/full
- US EPA WaterSense — Statistics and Facts— source of the ~900 billion gal/yearhouseholdleak figure, which is routinely and incorrectly cited as utility distribution loss — https://www.epa.gov/watersense/statistics-and-facts
- ASCE — 2025 Report Card: Drinking Water Infrastructure(grade C−; ~240,000 main breaks/year; $625 billion 20-year need) — https://infrastructurereportcard.org/cat-item/drinking-water-infrastructure/
- ASCE — 2025 Infrastructure Report Cardhome (overall C; drinking water C−, wastewater D+, stormwater D; $3.6 trillion ten-year gap) — https://infrastructurereportcard.org/
- ASCE — Bridging the Gapeconomic study ($3.7 trillion all-category gap; $2,700 per household — a figure coveringall eighteeninfrastructure categories, not water alone) — https://bridgingthegap.infrastructurereportcard.org/
- ASCE — Imagine a Day Without Water— source of "a water main break every two minutes, and an estimated 6 billion gallons of treated water lost every day" — https://infrastructurereportcard.org/imagine-a-day-without-water/
- OECD — Agriculture and Water Policies: Country Note, Israel— source of the flat-water/+70%-output and 64%→35% freshwater-share findings — https://www.oecd.org/content/dam/oecd/en/topics/policy-sub-issues/water-and-agriculture/oecd-water-policies-country-note-israel.pdf
- World Bank — Water Management in Israel: Key Innovations and Lessons Learned for Water-Scarce Countries— https://documents1.worldbank.org/curated/en/657531504204943236/pdf/Water-management-in-Israel-key-innovations-and-lessons-learned-for-water-scarce-countries.pdf
- Bank of Israel — Structural change in agriculture: decline in the share of water-intensive crop industries— https://www.boi.org.il/en/communication-and-publications/press-releases/structural-change-in-agriculture-decline-in-the-share-of-water-intensive-crop-industries/
- Jewish Virtual Library / Unpacked — How Israel Used Innovation to Beat Its Water Crisis— source of the 75%-of-Israeli-crops and ~5%-of-world-farmland drip adoption figures — https://www.jewishvirtuallibrary.org/how-israel-used-innovation-to-beat-its-water-crisis
- Netafim India — How to Calculate the ROI of Drip Irrigation Systems(industry estimate; treat cost and payback ranges as vendor-side) — https://www.netafimindia.com/blog/best-way-to-calculate-the-roi-of-drip-irrigation-systems/
- IWMI — Explainer: Alternate Wetting and Drying irrigation technique— https://www.iwmi.org/news/explainer-alternate-wetting-and-drying-irrigation-technique/
- IRRI — GHG Mitigation in Rice: Alternate Wetting and Drying— https://ghgmitigation.irri.org/mitigation-technologies/alternate-wetting-and-drying
- Effects of alternate wetting and drying irrigation on yield, water-saving, and emission reduction in rice fields: a global meta-analysis, Agricultural and Forest Meteorology — https://www.sciencedirect.com/science/article/abs/pii/S0168192324001904
- Kocis & Dahlke — Benefits and Economic Costs of Managed Aquifer Recharge in California, UC Davis — source of the $410 vs $2,100 per acre-foot comparison — https://escholarship.org/uc/item/7sb7440w
- California Department of Water Resources — Flood-MAR Hub— https://floodmar.org/
- Widely cited global irrigation statistics lack empirical support(2025) — the basis for this article's caution about the 70% figure — https://pmc.ncbi.nlm.nih.gov/articles/PMC12604014/