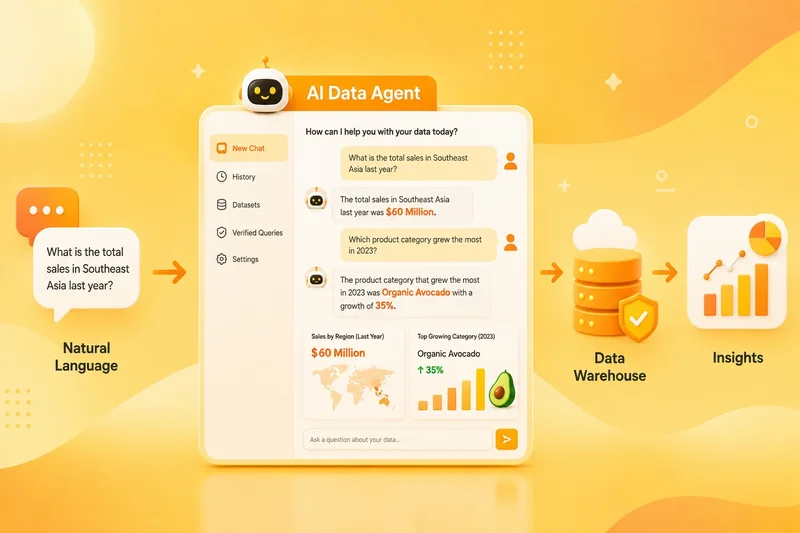
In my last article, Many Companies Use AI. Few Know How to Build an AI-Native Enterprise Data Platform, I discussed how to integrate AI into the enterprise data platforms. I also shared common problems in practice regarding AI applications in data engineering workflows and how to resolve them. In that article, I explained 3 key elements of a practical enterprise AI architecture – data agents, Ai-powered QA and AI governance.
In order to deep dive data agents, I created a demo called the Avocado Sales Analytics Agent. In this article, I’ll walk through the complete process of building it step by step.
What Is a Data Agent?
A data agent is an AI-powered conversational interface that enables business users to ask questions in plain language and receive accurate answers by querying data stored in a data warehouse.
Instead of waiting for data analysts to write complex SQL queries and generate reports, users can simply type: “How much is total TPV in Southeast Asia last year?” and get an immediate answer like “$ 60 Billion”.
Choosing the Right Approach
There are two ways to build a data agent. The first approach is to build from scratch with open-source orchestration frameworks such as LangGraph/LangChain, CrewAI and LlamaIndex. With this approach, you have complete control over the agent’s memory structures, strict business logic rules, and complex multi-agent execution loops.
For beginners, the second approach of deploying a data agent within a cloud data platforms is more practical and faster to implement. Today, most major cloud data platforms provide native, out-of-the-box data agents. For example, Snowflake offers Snowflake Cortex Agents which are low-code agent pipelines fully hosted inside Snowflake and allow users to ask natural language questions directly over secure enterprise data warehouses via Snowflake Intelligence. Databricks Genie is the managed conversational data intelligence tool within the Databricks ecosystem. Microsoft Fabric Ecosystem has Fabric Data Agents which support direct data connections to lakehouses, warehouses, KQL databases, and Power BI semantic models.
To build the Avocado Sales Analytics Agent demo, I chose Google Cloud Platform (BigQuery) because it provides full access to its Conversational Analytics features during the free trial, and it can be set up easily using a personal Google account. For the source data, I used the Avocado Prices dataset from Kaggle. The dataset was published by Justin Kiggins using data from the Hass Avocado Board and is available under the CC BY 4.0 license.
Building a Data Agent With No Code
Google Cloud’s BigQuery provides the Conversational Analytics API, which enables us to build conversational data agents on top of BigQuery datasets. Before building the data agent, the first step is to download Avocado Prices csv file from Kaggle and upload it to BigQuery. After uploading the dataset, it’s very important to understand the data schema of the tables that are used to build the agent because the agent needs to understand the data model—including table names, column names, data types, relationships, and business meanings. You need to understand the data thoroughly before you “teach” the agent how to analyze it correctly.
The next step is to build the data agent. You can navigate to BigQuery-> Agent, click “Create Agent”, then enter the agent name and description before selecting your dataset as the Knowledge source.
The instructions are the most critical part because it guides the AI to query data correctly, avoid errors, and give accurate answers.
Here are the principles of writing good instructions:
- Be clear:Use simple, precise language. Do not use hard or vague phrases.
- Give examples:Show the agent what good queries and responses look like.
- Set boundaries:Specify what the agent should and should not do.
- Define the role:Clearly describe who the agent is and who the users are.
Below is the example of the instructions that I wrote for the avocado data.
The agent has access to 1 core BigQuery table for answering avocado sales and pricing questions. All answers must be derived by querying this table:
A. Table and primary column definitions:
Primary Key: int64_field_0 (implicit row identifier)
Key Columns:
Date (DATE): The week of the sales data
region (STRING): US region where the sales occurred (it include cities, e.g., Albany, Atlanta, California, Chicago, etc., regions, e.g., West, and USTotal)
type (STRING): Avocado type - either "conventional" or "organic"
year (INTEGER): Year of the data
AveragePrice (FLOAT): Average price of a single avocado in USD
Total Volume (FLOAT): Total volume of avocados sold
Total Bags (FLOAT): Total number of avocado bags sold
Small Bags (FLOAT): Small bag sales volume (in units)
Large Bags (FLOAT): Large bag sales volume (in units)
XLarge Bags (FLOAT): Extra large bag sales volume (in units)
4046 (FLOAT): Sales volume for PLU 4046 (small avocados)
4225 (FLOAT): Sales volume for PLU 4225 (large avocados)
4770 (FLOAT): Sales volume for PLU 4770 (extra large avocados)
B. Metric Calculation Rules
When a user asks for a metric, use these SQL rules:
Total Sales Revenue (USD)   SUM(Total Volume * AveragePrice)
Weighted Average Price  SUM(Total Volume * AveragePrice) / SUM(Total Volume) — This is the average price per avocado, weighted by sales volume.
Total Individual Avocados Sold  SUM(Total Volume)
Total Bags Sold SUM(Total Bags)
Bag Size Breakdown  SUM(Small Bags), SUM(Large Bags), SUM(XLarge Bags)
PLU-specific Volume SUM(4046), SUM(4225), SUM(4770)
C. Date Handling Rules
Always use the Date column for time-based filtering and grouping
For "last year" queries, use the previous calendar year based on the current data
For "last month" or "last quarter", calculate based on the latest date in the data
When grouping by time:
Weekly: Group by Date
Monthly: Group by DATE_TRUNC(Date, MONTH)
Quarterly: Group by DATE_TRUNC(Date, QUARTER)
Yearly: Group by year
D. Queries (Example Questions)
Here are example questions and their corresponding SQL queries to guide the agent:
1.Natural Language: "How many total bags of avocados were sold in Chicago in 2017?"
SQL:
SELECT SUM(Total Bags) as total_bags
FROM avocado_data
WHERE region = 'Chicago'
AND year = 2017
2. Natural Language: "What was the average avocado price in California in 2017?"
SQL:
SELECT
    SUM(Total Volume * AveragePrice) / SUM(Total Volume) as weighted_avg_price
FROM avocado_prices
WHERE region = 'California'
  AND year = 2017
E. Data Quality Notes
The data includes both conventional and organic avocado types.
Crucially, distinguish between "volume" (individual avocados) and "bags". If a user asks for "total sales", clarify if they mean units (avocados) or bags. If unclear, it's often safer to report both or ask for clarification.
For any price calculations, always use the weighted average formula (SUM(Total Volume * AveragePrice) / SUM(Total Volume)) when aggregating across multiple records.
F. Common Mistakes to Avoid
Do NOT use AVG(AveragePrice) for aggregated price calculations. Always use the weighted average formula.
Do not confuse Total Volume (individual avocados) with Total Bags.
When comparing regions, ensure you are using the same time period.
For organic vs conventional comparisons, always include type in the GROUP BY clause.
G. Geographical Data Quality Note
The region column contains multiple overlapping geographical levels (cities, state regions, and "TotalUS"). Do NOT sum or aggregate data across these different region types. A query like SUM(Total Volume) GROUP BY region will produce a result, but the sum of all regions will not equal a meaningful total due to overlapping data.
When a user asks a question, treat the region as a single, categorical filter (e.g., WHERE region = 'California').
If a user asks for a "national total," use the specific 'TotalUS' region (e.g., WHERE region = 'TotalUS'). This is the only correct way to get a national aggregate.
Never attempt to sum across different region values to create a new total. This will lead to inaccurate results due to the overlapping hierarchy.
To help the agent enhance the understanding of the data and the best practices for querying it, the next step is to write the verified queries. Verified queries teach the agent how to generate correct SQL and answer questions consistently.
The screenshot above shows one example of a verified query. It guided the agent how to calculate the average avocado price in California in 2017. Without this verified query, the agent would do a simple average of AveragePrice, which is incorrect.
Building the Chat Application
For the users who have no access to BigQuery, the simplest solution is to build a lightweight Flask application that communicates with the Conversational Analytics API. The application is built with the Flask micro-framework in Python.
avocado-agent-app/
├── app.py
├── requirements.txt
├── .env
├── service-account-key.json
└── templates/
    └── index.html
Environment Configuration
When building the app, you need to store your credentials in a .env file. You should specify the API endpoint with LOCATION and identify where the agent was created with AGENT_LOCATION. Below is the template to create a .env file.
GOOGLE_APPLICATION_CREDENTIALS=/path/to/service-account-key.json
PROJECT_ID=project-avocado-xxxxxx
LOCATION=global
AGENT_LOCATION=us
AGENT_ID=agent_xxxxxxxx-xxxx-xxxx-xxxx-xxxxxxxxxxxx
Authentication
When the app calls the Conversational Analytics API, you need to authenticate with the service account key to Google so Google can verify the key’s signature and check the associated permissions. With a valid key, Google can grant the app access to the resources like BigQuery tables and the agent. You can create new key under IAM & Admin of Google Cloud Console and download the JSON file.
Agent Initialization and Chat Flow
Now, you can set up the connection between the application and Google Cloud’s Conversational Analytics API via agent initialization. During this phase, you should import the Google Cloud library, create a client object that can communicate with the API and define the agent path.
from google.cloud import geminidataanalytics
client = geminidataanalytics.DataChatServiceClient()
def get_agent_path():
    return f"projects/{PROJECT_ID}/locations/{AGENT_LOCATION}/dataAgents/{AGENT_ID}"
Then you can create a chat session which remembers context across multiple questions. A conversation is like a container that holds the entire chat history, the agent’s context and the current state of the interaction.
conversation = geminidataanalytics.Conversation(
    agents=[agent_path]
)
conversation_resource = client.create_conversation(
    parent=f"projects/{PROJECT_ID}/locations/{LOCATION}",
    conversation=conversation
)
The core interaction is to send the user’s question to the agent and receive the response.
convo_ref = geminidataanalytics.ConversationReference()
convo_ref.conversation = conversation_id
convo_ref.data_agent_context.data_agent = agent_path
chat_request = geminidataanalytics.ChatRequest(
    parent=f"projects/{PROJECT_ID}/locations/{LOCATION}",
    messages=[geminidataanalytics.Message(
        user_message={'text': user_message}
    )],
    conversation_reference=convo_ref,
)
responses = []
for response in client.chat(chat_request):
    if hasattr(response, 'text') and response.text:
        responses.append(response.text)
Response Filtering
By default, the API returns intermediate reasoning as system_message responses. For example, when I sent the question “What is the total volume sold in Albany in 2015?” to the agent. Instead of showing the final answer, it returned its entire thought process, including system messages and intermediate steps.
timestamp {
  seconds: 1785482359
  nanos: 260881000
}
system_message {
  text {
    parts: "Analyzing context"
    parts: "Retrieved context for 1 table."
    text_type: THOUGHT
  }
}
timestamp {
  seconds: 1785482363
  nanos: 449760000
}
system_message {
  text {
    parts: "Answering the \"Albany 2015 Total Volume\" Query"
    parts: "Alright, the user wants to know the total volume of something sold in Albany during 2015.
    My first step is to identify the relevant data source and columns.
    I\'ve got access to a table named `project-avocado-xxxxxx.avocado_data.avocado`. Looking at the schema (or recalling it from prior experience), I see a column named `Total Volume` which is of type FLOAT. This is exactly what I need to sum up.
}
...
...
To address this issue, you need to filter out messages with text_type == 1 (THOUGHT) and keep only messages with text_type == 2 (FINAL_RESPONSE).
I uploaded the full code on GitHub. The repository contains the following key files:
app.py: The complete Flask application with all routestemplates/index.html: The chat interface with a clean, user-friendly designrequirements.txt: All Python dependencies
Complete Workflow
The complete flow for Avocado Sales Analytics Agent is:
┌─────────────────────────────────────────────────────────────────┐
│                    USER ASKS A QUESTION                         │
│                  "What's the total volume in                    │
│                      Albany in 2015?"                           │
└─────────────────────────────┬───────────────────────────────────┘
                              │
                              ▼
┌─────────────────────────────────────────────────────────────────┐
│             1. AGENT INITIALIZATION (Setup)                     │
│  - Client connects to Google Cloud API                          │
│  - Agent path is constructed                                    │
└─────────────────────────────┬───────────────────────────────────┘
                              │
                              ▼
┌─────────────────────────────────────────────────────────────────┐
│             2. CONVERSATION MANAGEMENT (Session)                │
│  ┌─────────────────────────────────────────────────────────┐    │
│  │  Is this a new conversation?                            │    │
│  │  ├─ YES → Create new conversation, get ID               │    │
│  │  └─ NO  → Use existing conversation ID                  │    │
│  └─────────────────────────────────────────────────────────┘    │
└─────────────────────────────┬───────────────────────────────────┘
                              │
                              ▼
┌─────────────────────────────────────────────────────────────────┐
│             3. SENDING CHAT REQUEST (Execution)                 │
│  - Package: question + conversation ID + agent path             │
│  - Send to Google's API                                         │
│  ┌─────────────────────────────────────────────────────────┐    │
│  │  Google's Processing (behind the scenes):               │    │
│  │  ├─ Parse question → Understand intent                  │    │
│  │  ├─ Generate SQL → SELECT SUM(`Total Volume`) ...       │    │
│  │  ├─ Run query → Execute against BigQuery                │    │
│  │  └─ Format answer → "4,029,896.43"                      │    │
│  └─────────────────────────────────────────────────────────┘    │
└─────────────────────────────┬───────────────────────────────────┘
                              │
                              ▼
┌─────────────────────────────────────────────────────────────────┐
│                    DISPLAY ANSWER TO USER                       │
│              "The total volume in Albany in 2015                │
│               was 4,029,896.43 individual avocados."            │
└─────────────────────────────────────────────────────────────────┘
Final Thoughts
Data agents are very helpful in reducing the workload of data teams, improving organizational productivity and effectively bridging the gap between business users and data teams.
The Avocado Sales Analytics Agent can complete the following workflow:
Parse the natural language questions -> Generate the appropriate SQL query
-> Execute the query against BigQuery -> Return a plain-English answer with the data
- Better semantic understanding of business terminology
- Richer business context through reusable context containers
- More natural, human-like conversations
- Better support for complex analytical questions
In a follow-up article, I’ll show you how to use the SDK to build reusable context containers that package business rules, definitions, and golden queries for more complex scenarios.