Why we keep an eye on the housing-debt-to-income ratio.
By Wolf Richter for WOLF STREET.
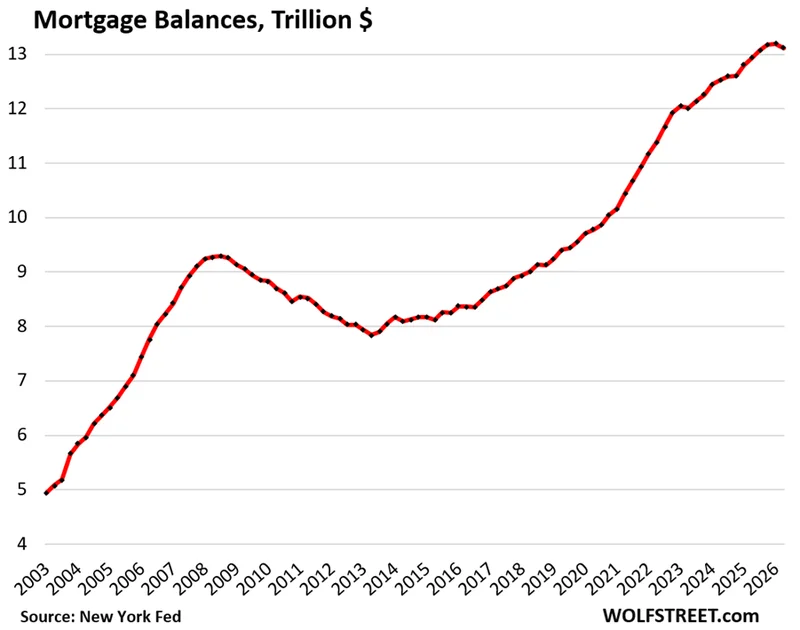
Mortgage balances fell by $74 billion (-0.6%) in Q2, to $13.12 trillion, according to the Household Debt and Credit Report from the New York Fed, which gets the data from Equifax. The unusual decline “was due to a temporary gap in the reporting of mortgages on credit reports due to a transfer of servicing,” the New York Fed explained.
This technical issue came on top of stalled mortgage originations as sales of existing homes sank deeper into the mud and as sales of new homes fizzled despite large-scale incentives and lower prices by homebuilders.
Year-over-year, mortgage balances rose by $187 billion, or by 1.4%, the smallest year-over-year percentage gain since 2016.
But here come the HELOCs: +45% since Q1 2021.
Balances of Home Equity Lines of Credit spiked by 2.8% in Q2, and by 11.6% year-over-year, to $459 billion.
Since Q1 of 2021, the low point, HELOC balances have surged by 45%.
These are actual balances drawn on HELOCs and do not include the unused portion of those lines of credit.
HELOC v. cash-out refinancing. If homeowners want to draw cash out of the home’s equity, thereby adding leverage to the home, they can choose between refinancing the existing 3% mortgage with a larger 6% mortgage; or keeping the 3% mortgage and adding a much smaller HELOC at 8% or 9%. And for many homeowners, that math has been tilting in favor of HELOCs, and HELOC balances have surged.
A HELOC is a second-lien loan on the home that increases leverage and that, if defaulted on, can lead to foreclosure and loss of the home, even if the first-lien mortgage is current, which is why HELOCs add an additional layer of risk for homeowners, lenders, and the mortgage market, and they did some additional damage during the Housing Bust and Mortgage Crisis.
The burden of housing debt and risk of default.
A debt-to-income ratio is a standard metric to evaluate the burden of a debt and the credit risk. For “housing debt” we combine all mortgages and HELOCs. And for income, we use disposable income (released by the Bureau of Economic Analysis).
Disposable income consists of after-tax wages, plus income from interest, dividends, rentals, farm income, small business income, transfer payments from the government, etc.
But it excludes capital gains, which is where the wealthy make most of their money. Excluded are thereby income from stock-based compensation plans and capital appreciation where billionaires make their billions.
Disposable income has grown over the years because the number of households has grown over the years, and in addition, the income per household has grown, and so total household income has grown faster than housing debt over the years, and the burden of this housing debt on household income has declined over the years.
So the housing-debt-to-income ratio dipped in Q2 to 57.4%, the third-lowest on record, behind only Q2 2020 and Q1 2021 when government payments rained down upon households and distorted disposable income beyond recognition. In 2007, at the beginning of the Mortgage Crisis, it had gone over 90%.
Why we keep an eye on this ratio. The chart above depicts the foundation of the Mortgage Crisis: Consumers piled on housing debt and became way overleveraged because home prices had exploded, and households kept chasing after them with ever bigger mortgages, and others used the soaring home prices to turn their homes into elephantine ATMs, drawing cash out by refinancing the home or by obtaining a HELOC, and housing debt grew far faster than disposable income, and the ratio spiked through 2007, when the ratio exceeded 90% and all heck was breaking loose.
The surging debt-to-income ratio was a warning sign starting in 2004 – one of many – of things to come.
There will always be defaults and foreclosures, and they ebb and flow with economic conditions, such as unemployment. But a widespread mortgage crisis doesn’t come out of nowhere; it builds with overleverage. And that’s not happening now.
The 90-plus day delinquency rate dipped for mortgages and edged up for HELOCs, after the near-0% levels during the pandemic’s forbearance programs that removed the delinquency status from delinquent mortgages.
The balances of mortgages that were 90 days or more past due at the end of Q2 dipped to 0.99% of total mortgage balances outstanding (red in the chart below);
The balances of HELOCs that were 90 days or more past due ticked up to 0.99% of total HELOC balances (blue).
Both are roughly where they’d been during the Good Times in 2018 and 2019.
New foreclosures ticked down to 55,160 in Q2. During the era of mortgage forbearance, foreclosures were essentially impossible; like serious delinquencies, they’d dropped to near-zero.
Foreclosures have risen from these near-zero lows but have remained below the low end of the Good Times in 2018-2019, and far below the number of foreclosures in prior years.
What could drive up serious delinquency rates and foreclosures on a large scale are the three factors that drove up delinquency rates during the Housing Bust:
- Overleverage – see the housing-debt-to-disposable-income ratio above. That’s always the key. Borrowers who are not overleveraged rarely default.
- Home prices that plunge back to earth, after having exploded, when people, especially mom-and-pop landlords, including accidental landlords, default on a property that would sell for far less than the outstanding mortgage balance. Mortgages that are deeply underwater are a precondition for any large wave of foreclosures; if home prices don’t plunge, a stressed borrower can usually sell the home, pay off the delinquent mortgage, and maybe walk away with a little cash.
- An unemployment crisis. But during the Housing Bust, the unemployment crisis started a couple of years after the Housing Bust had begun and was a result of the Financial Crisis that was in part a result of the Housing Bust.
Every default has its own reasons and complications, and they happen all the time, but not on a large scale. The banking system and the legal system deal with those routinely, and so there are foreclosures, but the numbers are small, and these costs are priced into the mortgage rates and fees, and money is still being made, and the economy rolls on. It only becomes a problem for the overall economy when it takes on a very large scale, as it did last time.
Reminder: Who’s on the hook? Mostly taxpayers.
About 65% of all mortgages outstanding, including nearly all subprime mortgages, are in one form or another guaranteed by the US government, and that portion of the mortgage risk has been transferred from banks to taxpayers – one of the most fundamental changes coming out of the Financial Crisis.
The government entities – GSEs (Fannie Mae and Freddie Mac) and government agencies (Ginnie Mae, FHA which insures subprime mortgages with low down payments, VA, etc.) – buy mortgages from lenders, package them into Mortgage-Backed Securities, and the sell the MBS to investors. If a mortgage turns into a loss, the issuer of the MBS makes MBS holders whole and takes the loss. These “agency” MBS have a similar credit risk to Treasury securities, near zero.
Investors are on the hook for 15% of the mortgages. These are mortgages that didn’t qualify for government backing and that were securitized and sold as “private-label” MBS to bond funds and pension funds around the world.
About 4,000 banks and over 4,000 credit unions are on the hook for less than 20% of the total housing debt (Federal Reserve data). A big mortgage meltdown will cause them some pain but won’t threaten to topple the financial system, like it did last time.
And in case you missed it: Household Debts, Debt-to-Income Ratio, Delinquencies, Foreclosures, Collections & Bankruptcies in Q2 2026
Enjoy reading WOLF STREET and want to support it? You can donate. I appreciate it immensely. Click on the mug to find out how: